The method Multiscale Multifractal Analysis (MMA) was first proposed in:
J. Gierałtowski, J. J. Żebrowski, and R. Baranowski, "Multiscale multifractal analysis of heart rate variability recordings with a large number of occurrences of arrhythmia," Phys. Rev. E 85, 021915 (2012) [DOI: 10.1103/PhysRevE.85.021915].
Please cite the above publication when referencing this material, and also include the standard citation for PhysioNet: Goldberger AL, Amaral LAN, Glass L, Hausdorff JM, Ivanov PCh, Mark RG, Mietus JE, Moody GB, Peng C-K, Stanley HE. "PhysioBank, PhysioToolkit, and PhysioNet: Components of a New Research Resource for Complex Physiologic Signals," Circulation 101(23):e215-e220 [Circulation Electronic Pages; http://circ.ahajournals.org/content/101/23/e215.full]; 2000 (June 13).
Description
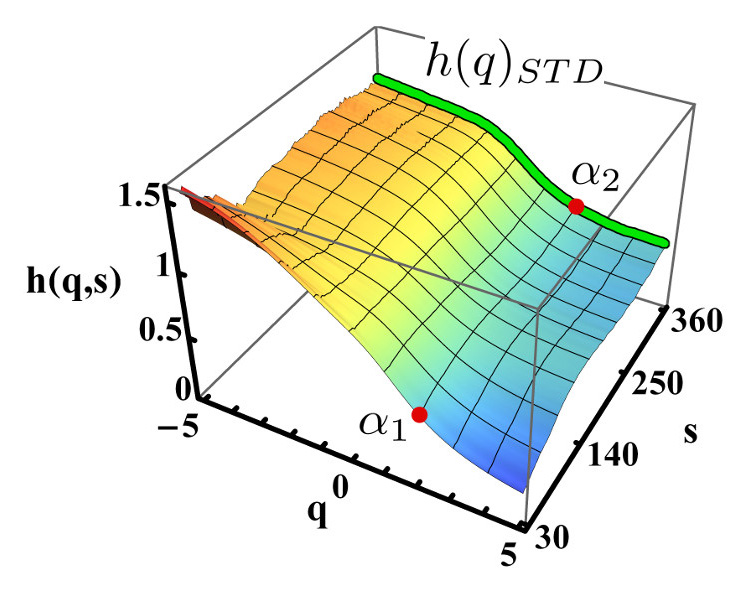
Multiscale multifractal analysis (MMA) (Gierałtowski et al., 2012) is a time series analysis method, designed to describe scaling properties of fluctuations within the signal analyzed. The main result of this procedure is the so called Hurst surface h(q,s) , which is a dependence of the local Hurst exponent h (fluctuation scaling exponent) on the multifractal parameter q (Kantelhardt et al., 2002) and the scale of observation s (data window width).
MMA is a generalization of the standard multifractal detrended fluctuation analysis (MF-DFA) method (Kantelhardt et al., 2002) and adds the dependence on scale, yielding a broader analysis of the fluctuation properties as well as more universal and stable results. As a generalization, the method corresponds directly to earlier fractal signal analysis methods. On the Hurst surface h(q,s) , the results of the standard DFA (Peng et al., 1994) method are represented by one (or two) single points corresponding to the exponent a (or a1 and a2 ). The results of standard MF-DFA are represented by a single line: a cross section of h(q,s) at a constant s (in standard realization at s= 360).
The Hurst exponent larger than 0.5 is a measure of persistency of the signal (West et al., 2003; Schroeder, 1992) meaning how probable is it that, if the signal has just increased, the next sample will also be an increase of the signal value (and conversely for a decreasing signal). As usual in multifractal analysis, for a q>0 parameter the large fluctuations in the data are analyzed, while, for q<0, - the small fluctuations.
MMA eliminates the need for initial assumptions about the presumed time scale of the investigated problem. The new method is able to characterize monofractality or multifractality of the time series in a wide range of frequencies (scales) simultaneously and may be easily applied to data with strong crossover properties. It can correctly recognize fractal properties of time series even for relatively small scales, and it is capable of properly recognizing different fractal properties in small and large scales simultaneously.
The Matlab code, MMA.m, in this directory contains function calculating Hurst surface h(q,s) for a time series. Function name: MMA. As a parameter function takes name of a single file or directory with files to be analyzed. File needs to have .txt extension and contain at least 1200 datapoints.
Usage
Usage example:
MMA(filename) or MMA(directory_name)
where filename (e.g., C:\directory\filename.txt) should be a full-path filename; and directory_name (e.g., C:\directory) is the name of the directory containing the input files.
Options
The MMA.m file contains a set of parameters, which if needed, can be adjusted by the user:
- overlapping = 0
- 0 - time series is partitioned into no overlapping windows of analysis,
- 1 - time series is partitioned into overlapping windows of analysis, step between consecutive windows is = 1 (much longer calculations)
- smin = 10
- minimal s scale used, when calculating Fq(s) functions family . Default is smin = 10.
- smax = 600
- maximal s scale used, when calculating Fq(s) functions family, has to be multiple of 5. Default is smax> = 600; in general should be near to N/50, where N is a time series length.
- qmin = -5
- minimal multifractal parameter q used (default -5)
- qmax = 5
- maximal multifractal parameter q used (deafault 5)
- precisionMode = 0
- 0 (default) better looking plot, smaller files, faster calculations; set 1 for enhanced precision (smaller q and s steps)
Sample Input & Output
Sample input time series can be found in the subfolder Sample_time_series_with_results.
Sample2_monofractal_1_over_f^1_noise - 1/f noise, normal distribution (0.004,0.016), series length 2^14. Another classic monofractal time series sample. For all scales s and for all q parameters we expect Hurst exponent h = 1 (i.e. flat surface).
Sample3_multifractal_Cauchy_distribution_noise - Random number series with Cauchy distribution (heavy-tailed distribution). Sample of a time series with strong multifractality stemming only from distribution.
Sample4_mono_multi_fractal_phase_transition - Special example of time series with strong multifractal properties for short scales s and with strong monofractal properties for small scales s. Time series used as an example in (Gierałtowski et al. 2012) (see Fig. 3).
Sample5_RR_interval_series_healthy - night-time RR interval series for a healthy, 25 years old man. Characteristic, highly repetitive shape of Hurst surface for RR interval series of healthy adults during sleep.
The corresponding output from MMA using the above input files can be found in the subfolder Sample_time_series_with_results/MMA_results/.
References
[Gierałtowski et al., 2012] J. Gierałtowski, J. J. Żebrowski, and R. Baranowski, "Multiscale multifractal analysis of heart rate variability recordings with a large number of occurrences of arrhythmia," Phys. Rev. E 85, 021915 (2012) [DOI: 10.1103/PhysRevE.85.021915].
[Kantelhardt et al., 2002] J. W. Kantelhardt, S. A. Zschiegner, E. Koscielny-Bunde, S. Havlin, A. Bunde, and H. E. Stanley, "Physica A: Statistical Mechanics and its Applications," Physica A 316, 87 (2002).
[Peng et al., 1994] C.-K. Peng, S. V. Buldyrev, S. Havlin, M. Simons, H. E. Stanley, and A. L. Goldberger, "Mosaic organization of DNA nucleotides," Phys. Rev. E 49, 1685 (1994).
[West et al., 2003] B. J. West and N. Scafetta, "Nonlinear dynamical model of human gait," Phys. Rev. E 67, 051917 (2003).
[Schroeder, 1992] M. Schroeder, Fractals, Chaos, Power Laws: Minutes from an Infinite Paradise (Freeman, New York, 1992).
 Name                             Last modified      Size  Description Parent Directory                                      -
 Sample_time_series_with_results/ 2015-01-22 15:33    -
 MMA_vs_DFA_vs_MF-DFA.jpg         2015-01-22 17:36  139K
 MMA.m                            2015-01-22 15:54  5.0K
|
If you would like help understanding, using, or downloading content, please see our Frequently Asked Questions. If you have any comments, feedback, or particular questions regarding this page, please send them to the webmaster. Comments and issues can also be raised on PhysioNet's GitHub page. Updated Friday, 28 October 2016 at 16:58 EDT |
PhysioNet is supported by the National Institute of General Medical Sciences (NIGMS) and the National Institute of Biomedical Imaging and Bioengineering (NIBIB) under NIH grant number 2R01GM104987-09.
|