There are essentially two basic types of data in the MIMIC II database; clinical data stored in a relational database, and bedside monitor waveforms and his/her associated derived parameters and events stored in flat binary files (with ASCII header descriptors), and sorted with one directory per patient. Only a fraction of the total records in the relational database have associated waveform data. Of over 25,000 patients in the MIMIC II database, around 20,000 are adults and around 5000 are neonates. There are approximately 3000 waveform records of which around 2500 have been matched to the clinical data in the relational database.
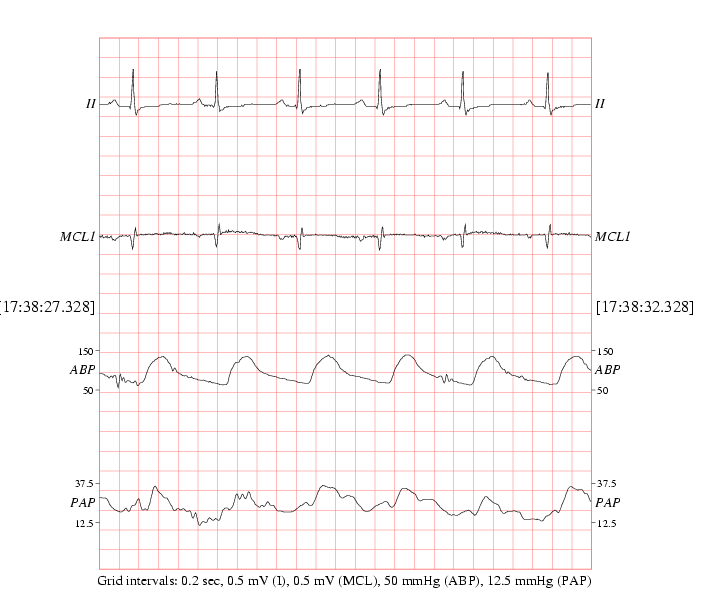
Note that we define waveforms to be rapidly sampled (125Hz) signals recorded by the bedside monitors such as electrocardiograms (ECG) and arterial blood pressure (ABP) waveforms, illustrated in Figure 1.2. We define trends to be a time series of parameters derived from the waveforms by the bedside monitors, such as heart rate, systolic blood pressure, cardiac output and relative oxygen saturation. Of course, time series of repeated clinical measurements are also found in the relational database, such as pH levels, laboratory values and administered medications.
|
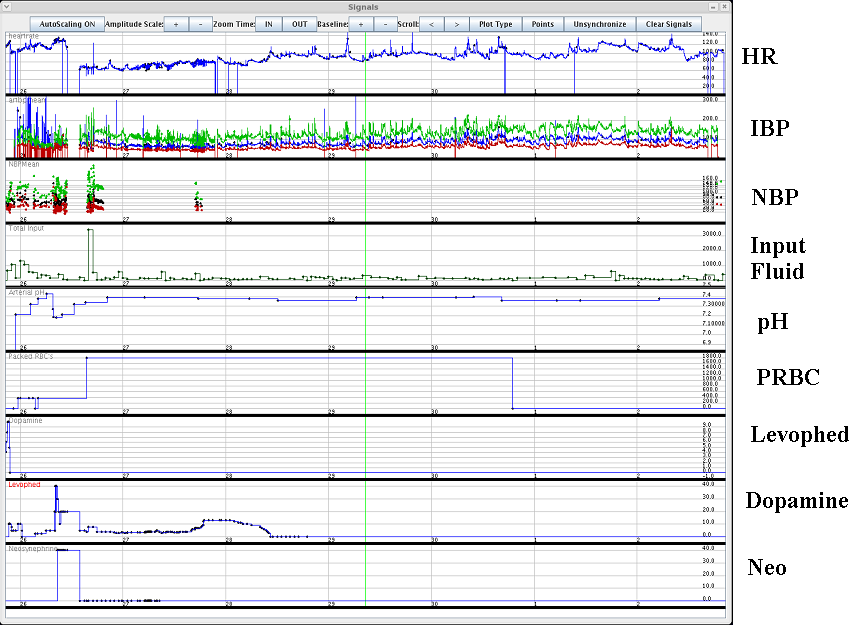
Figure 1.3 illustrates a typical set of time series (or `trends'). The first two channels of data are HR (heart rate) and IBP (invasive blood pressure) which are taken from the flat file trend data. The third trace (NBP: non-invasive blood pressure) is recorded by a nurse from oscillometric cuff inflations and so is sampled much more sparsely. Events are automatically generated markers triggered by the bedside monitor algorithms. These include arrhythmia alarms, error messages (such as cable disconnections) and beat labels. These data are therefore unevenly sampled. Numeric trends are generally produced by the bedside monitors once per second, although after transmission to the central ICU database, they are often stored only once every 5 to 60 minutes. See section 2.3 for more details on these data types. A list of all the possible alarms can be found in table 2.6, ranked by their frequency in the database, together with associated statistics concerning the mean, minimum and maximum values at which the thresholds are set by the clinical staff.
|
Clinical data are recorded far less frequently than bedside monitor data and come from a variety of databases. These include the laboratory results, pharmacy provider order entry (POE) records, admission and death records, demographic details, discharge summaries, ICD-9 codes, procedure codes, microbiology and lab tests, imaging and ECG reports and the ICU central database (which includes some subset of the bedside monitor trends, drip rates, free text nursing notes and nurse-verified down-sampled trends, amongst other information). A selection of these parameters can be seen in Figure 1.3. A more detailed description of the content of these databases can be found in section 2.1.