Next: 2.3.4 Alarms and Inops
Up: 2.3 High resolution waveforms
Previous: 2.3.2 The WFDB software
Contents
2.3.3 MIMIC II waveform records
All MIMIC II waveforms are stored in WFDB
format. Table 2.3 summarizes the types
of files you will find for the MIMIC II
waveform database.
The records vary in length; some are several weeks in duration. It is
common for the signal sources to be interrupted or changed
occasionally during recordings of such a long duration. In a typical
waveform database, you will find a directory layout including several
record names or ``cases''. All files associated with each record are
gathered in a sub-directory named after the record. For example, the
files associated with record a40001 are all located within the
directory named a40001.
Table 2.4:
WFDB file types
| File type |
Extension |
Description |
| Header |
.hea |
Contain signal file names and attributes
in plain text format. |
|---|
| Signal |
.dat |
Contain signals binary data. |
|---|
| Annotations |
-dependent, e.g. ``.al'' for alarms,
``.wqrs'' for ECG beat annotations |
Contain signal custom annotations in
binary format |
|---|
| Calibration |
.cal |
Contain signal calibration
specifications. |
|---|
|
Table 2.4 presents some useful WFDB
commands to navigate through the waveform records. In a typical WFDB
database record, a header file specifies the names of the associated
signal files and their attributes, briefly:
- Record name: a string of characters that identifies the record.
- Number of channels: an integer greater than zero.
- Sampling rate: an integer or floating-point number, interpreted
as samples per second.
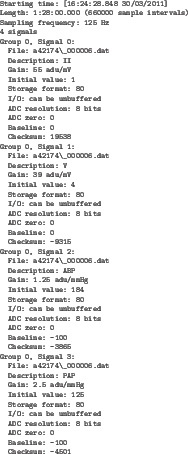
Figure 2.17, shows the output of the
``wfdbdesc'' command, which outputs a human-readable description of a
waveform record.
Table 2.5:
Useful WFDB commands
| Command |
Description |
| wfdbdesc |
Reads specifications for the signals described in the
header file for record. |
|---|
| rdsamp |
Reads signal files for the specified record and writes
the samples as decimal numbers on the standard output. Each line of
output contains the sample number and samples from each signal,
beginning with channel 0, separated by tabs. |
|---|
| wave |
Can be used to view the specified WFDB record or
records on any display controlled by an X11 server. It includes
facilities for interactive annotation editing. The keyboard and mouse
are used to control the display interactively |
|---|
|
Figure 2.17:
Sample output for wfdbdesc
 |
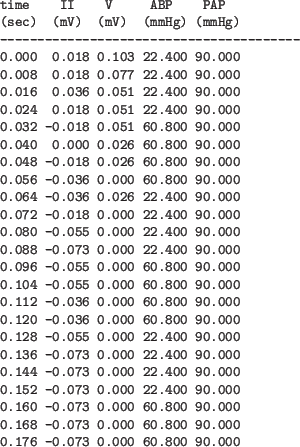
If you want to display the signal contents of a particular record, you
can use the ``rdsamp'' command. Figure 2.18 shows
the output of this program.
Figure 2.18:
Sample output of rdsamp
 |
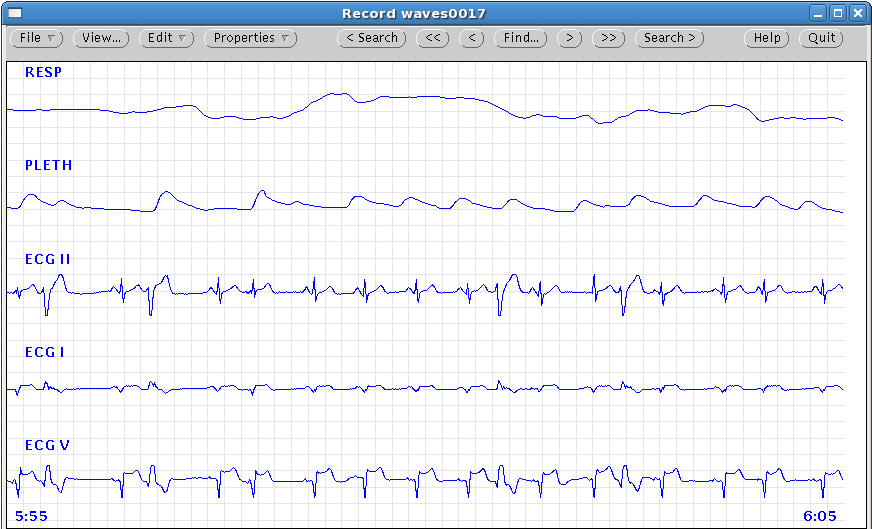
Another option is to use a visualization tool like WAVE, or ATM
(http://www.physionet.org/cgi-bin/ATM),
to display the contents of a particular waveform
record. Figure 2.19 shows the display of a
particular waveform record. Note that the signal processing algorithms
can be run from this viewer.
Figure 2.19:
Sample waveform
record
|
|
Next: 2.3.4 Alarms and Inops
Up: 2.3 High resolution waveforms
Previous: 2.3.2 The WFDB software
Contents
djscott
2011-09-07