A first example
The script /examples/first_simple_example.m shows the use of the ECGkit
in multimodal-cardiovascular recordings included with this kit in the recordings folder.
These recordings include arterial blood pressure (ABP), plethysmographic (PPG)
and electrocardiogram (ECG) signals. The following
tasks will be performed in the first example:
- Heartbeat/QRS detection
- ABP/PPG pulse detection
- ECG wave delineation
- Heartbeat classification
- Report generation
The script is prepared to perform visual inspection of the automatic algorithms, with
the bGUICorrection flag, but it is disabled by default. In the following listing,
you can see a typical output of the example script.
>> first_simple_example()

Description of the process:
 + Recording: \your_path\ecg-kit\recordings\208.hea
 + Task name: QRS_detection

Processing QRS detector gqrs
Processing QRS detector wavedet
No multilead strategy used, instead using the delineation of lead MLII.
Processing QRS detector wqrs

##############
# Work done! #
##############


Results saved in
 + \your_path\ecg-kit\recordings\208_my_experiment_name_QRS_detection.mat
The script starts with the QRS complex detection, producing a result file, which can be used later by other tasks, or to access results. Then the script follows with the pulse detection task:
##############
# Work done! #
##############


Results saved in
 + \your_path\ecg-kit\recordings\208_my_experiment_name_QRS_detection.mat


Description of the process:
 + Recording: \your_path\ecg-kit\recordings\208.hea
 + Task name: PPG_ABP_detector

Could not find any PPG/ABP signal, check the lead description of the recording:
 +  MLII
 +  V1

Requirements not satisfied in \your_path\ecg-kit\recordings\208.hea for task PPG_ABP_detector.

######################
# Nothing to do here #
######################
As the default recording pointed by the script is the 208 from the MIT arrhythmia database, the task exits without finding any pulsatile signal, such as ABP or PPG. After exiting, it starts with the delineation task
 Description of the process:
 + Recording: \your_path\ecg-kit\recordings\208.hea
 + Task name: ECG_delineation

Processing ECG delineator wavedet
No multilead strategy used, instead using the delineation of lead MLII.

##############
# Work done! #
##############


Results saved in
 + \your_path\ecg-kit\recordings\208_my_experiment_name_ECG_delineation.mat
The result produced is exactly the same as the QRS detection task. This can be convenient for backing up
intermediate results and reproducing experiment results. Other interesting aspect to differentiate experiments
is the user_string property of the ECGwrapper object. Note that the results produced retain the
user string suffix. After that, the example performs heartbeat classification and finally produces a report.
Description of the process:
 + Recording: \your_path\ecg-kit\recordings\208.hea
 + Task name: ECG_heartbeat_classifier

 + Using gqrs_MLII detections.

15-Apr-2015
Configuration
-------------
+ Recording:  (AHA)
+ Mode: auto (12 clusters, 1 iterations, 75% cluster-presence)

##############
# Work done! #
##############


Results saved in
 + \your_path\ecg-kit\recordings\208_my_experiment_name_ECG_heartbeat_classifier.mat
As a result, the report found in \your_path\ecg-kit\recordings\208_full.pdf looks like this:
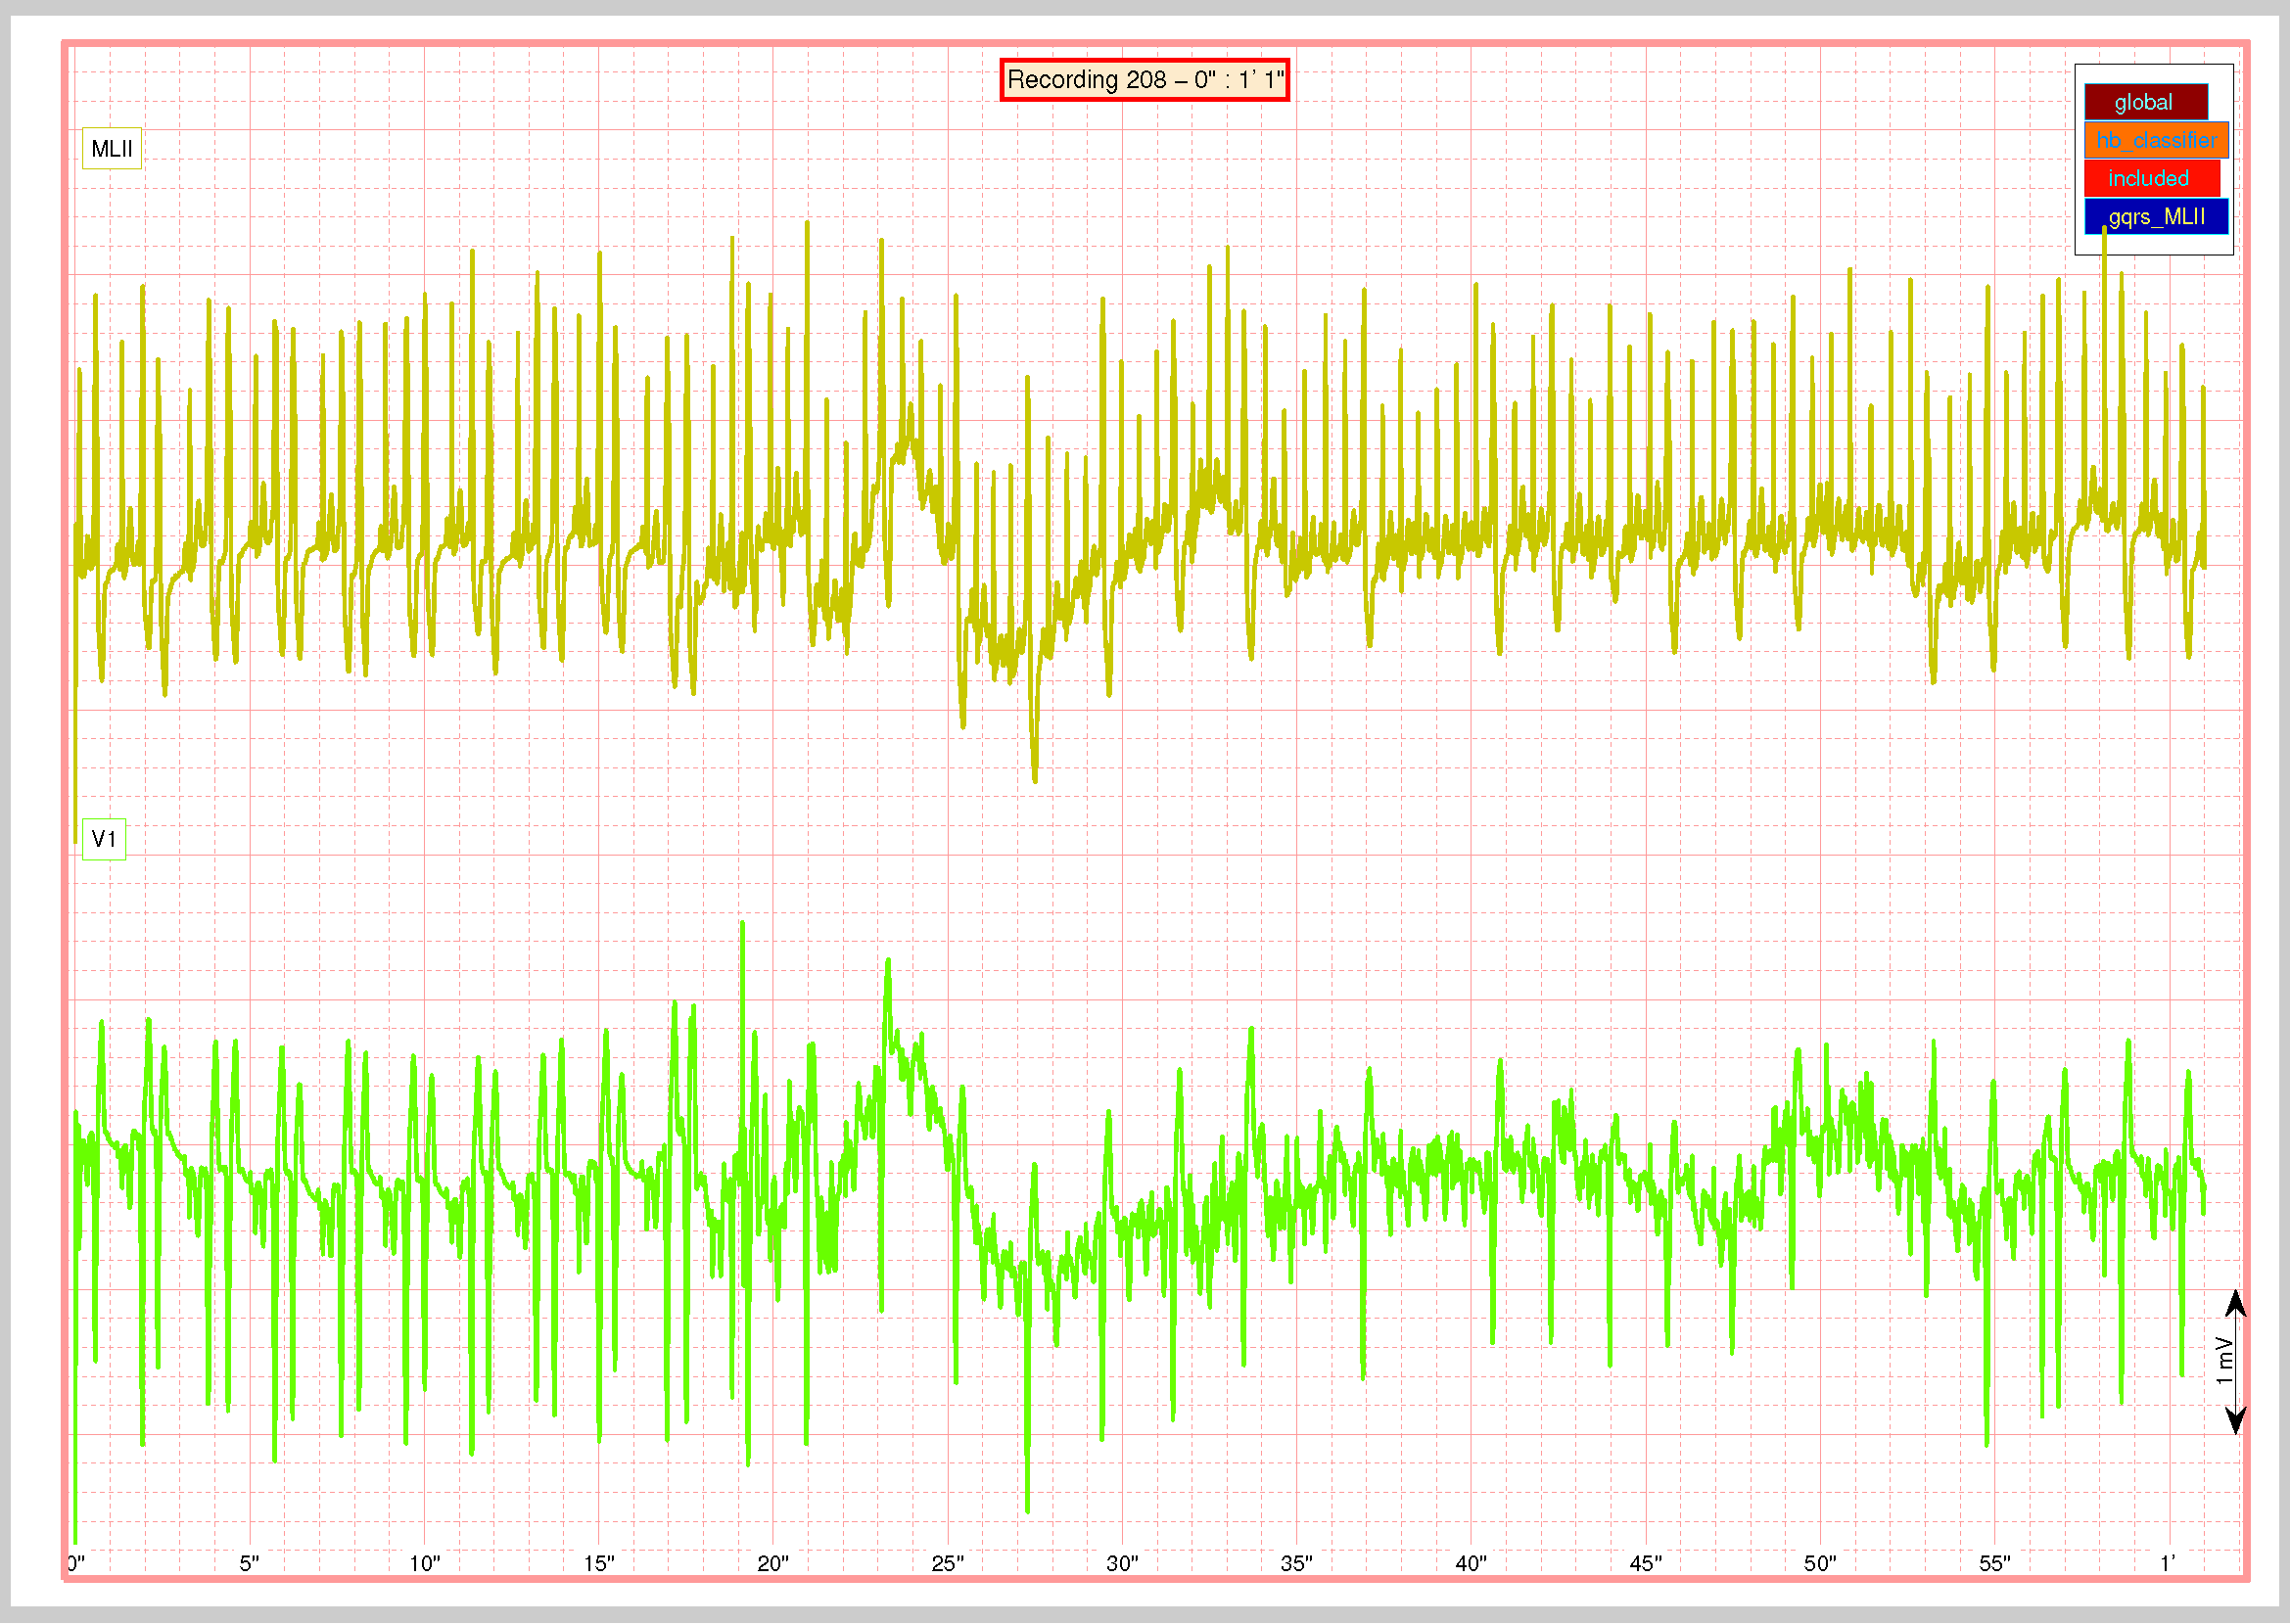
First in the report you will find an overview of the signal.
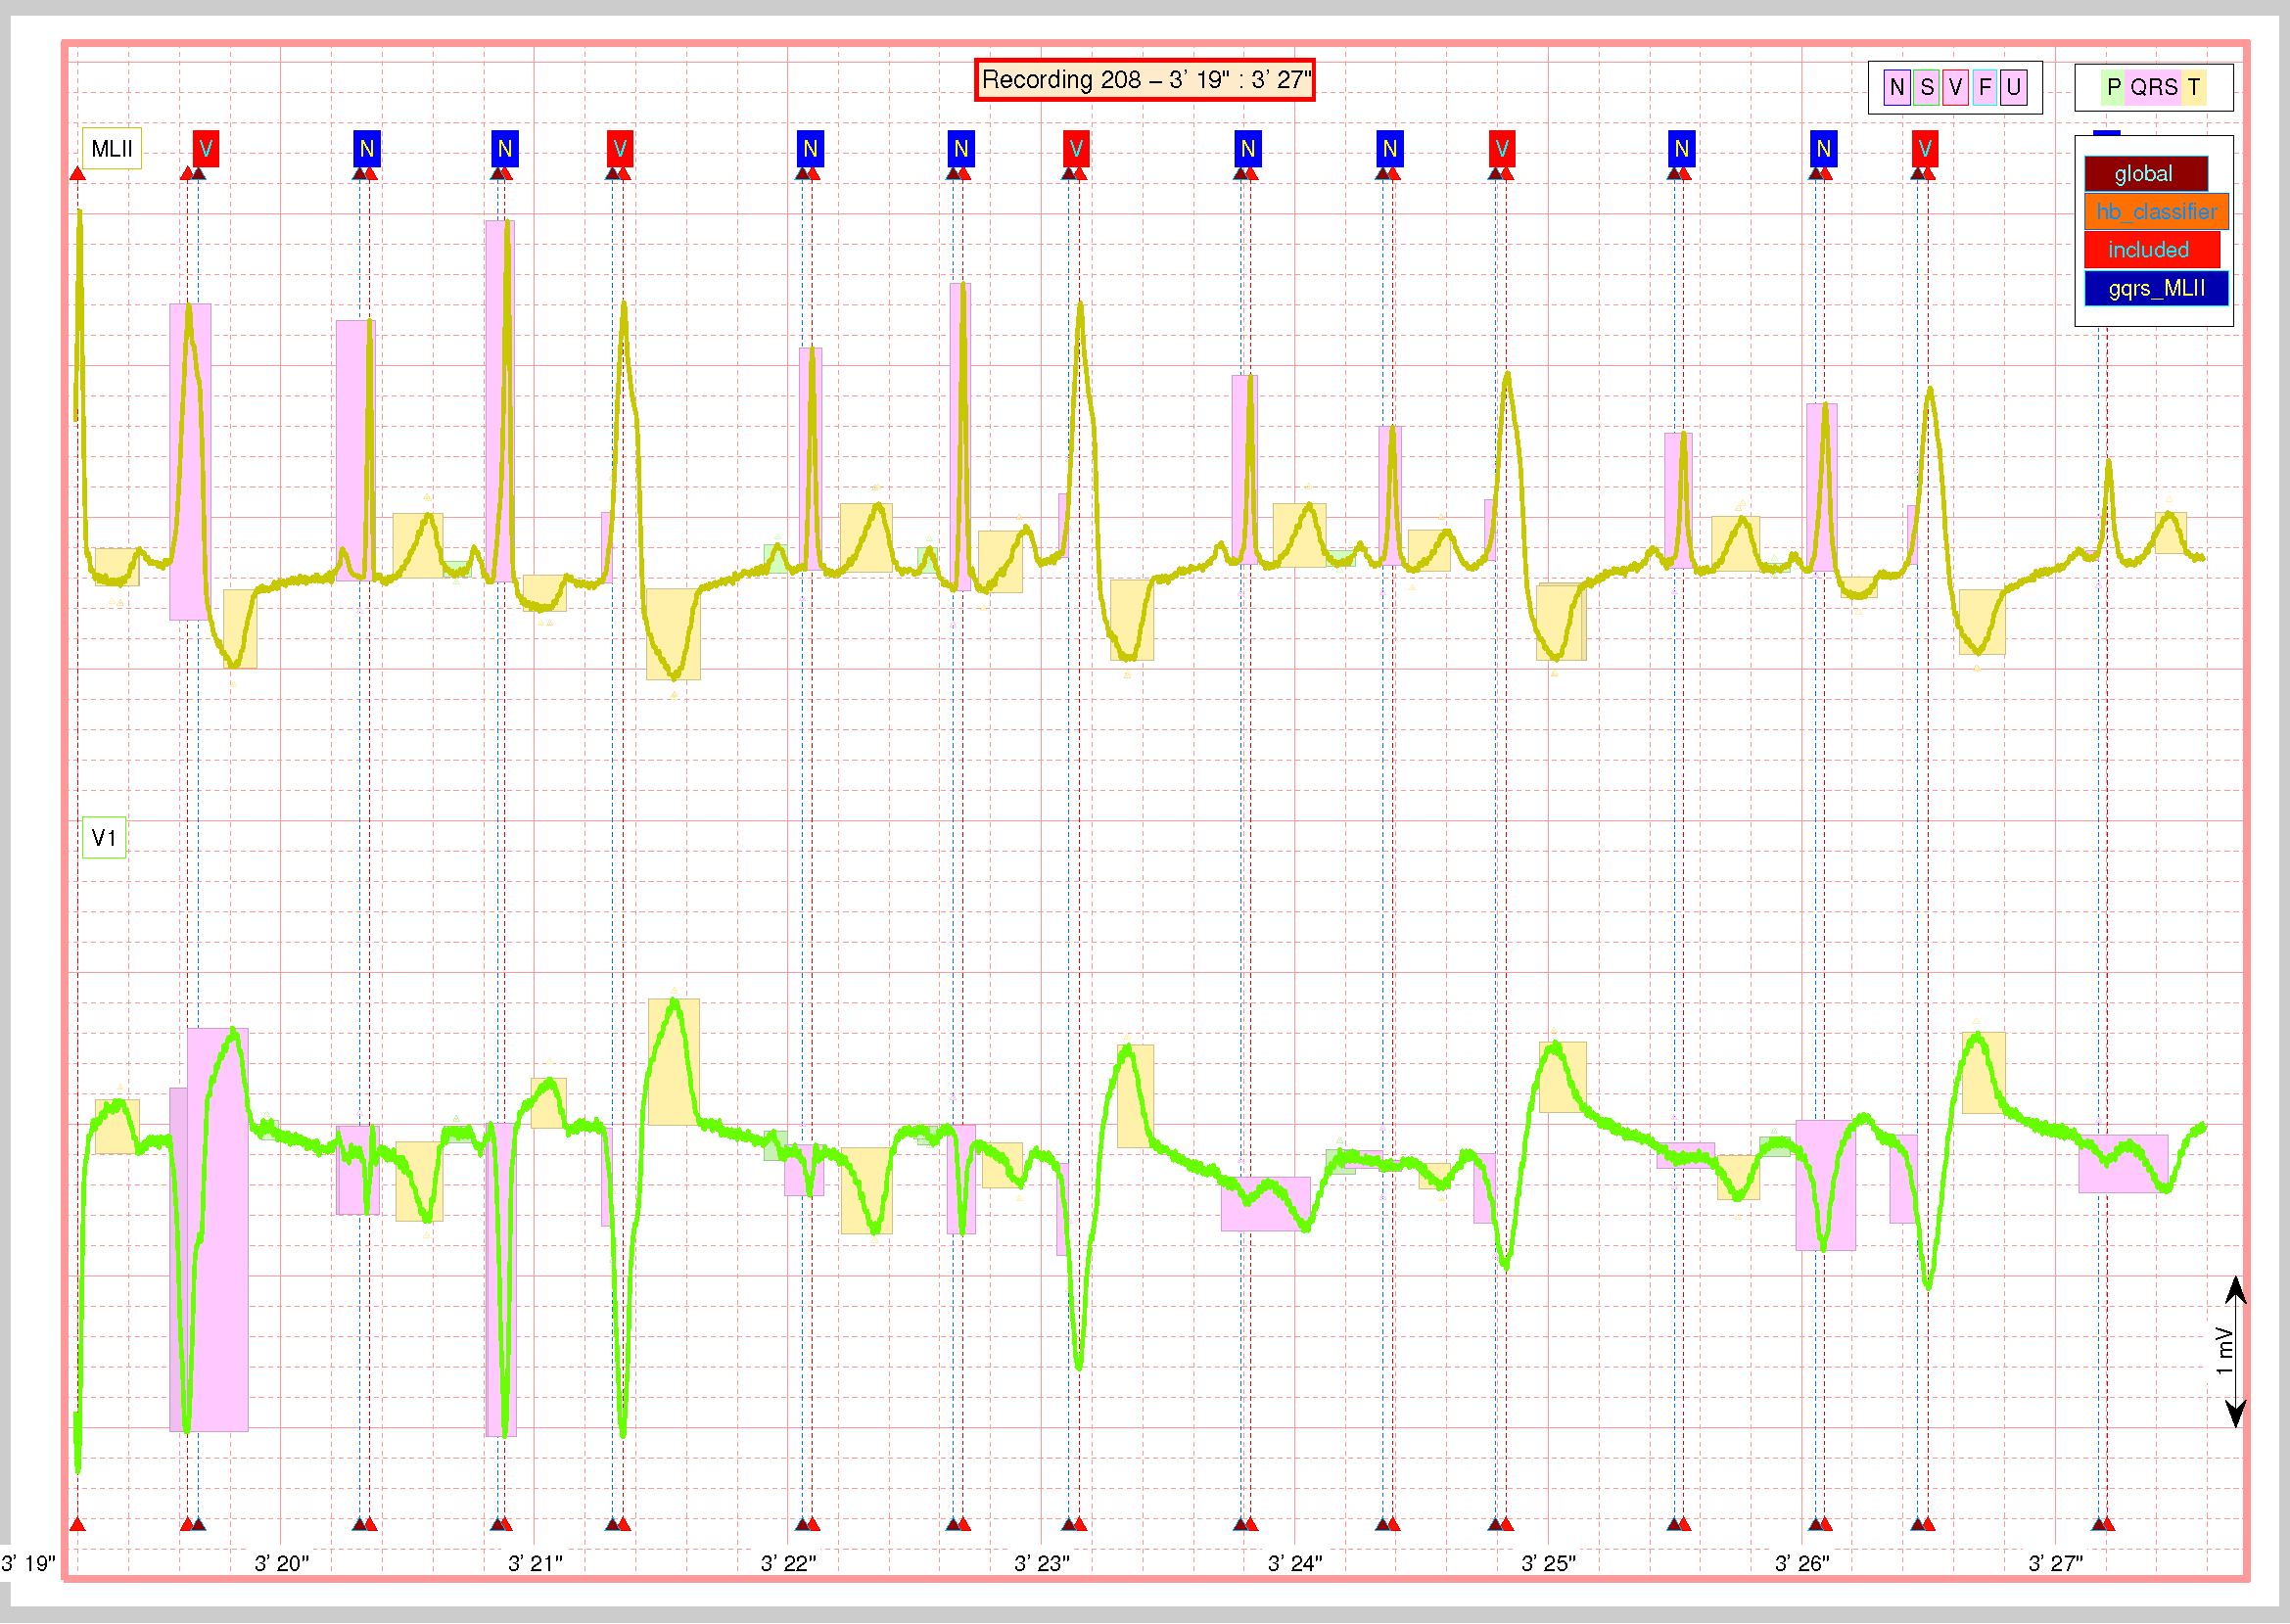
A more detailed view can be found in the last part of the report, you will find the results of the QRS detection, delineation and heartbeat classification. In the top right of the chart you will find the references for interpreting the results displayed. For example, QRS detection legend indicates a colour-code for the dotted lines with triangles in the extremes, placed around the QRS complexes. As recording 208 does not presents much controversy respect QRS detection, all detections are clustered around each heartbeat, but the legend indicates:
- global, the wavedet multilead detection.
- hb_classifier, the detection used by the heartbeat classifier.
- included, the gold-standard, visually-audited Physionet detections.
- gqrs_MLII, the detections of gqrs algorithm in lead MLII.
Above the legend of QRS detections, it is the delineation legend, with a colour-code for identifying each wave. For example in pink you can see several QRS complexes correctly segmented, but three of them are wrong. If you pay attention to the extreme widened ventricular beats, they are very underestimated. T-waves in orange, seems quite correctly measured, and P-waves as you can see are not correctly measured at all.
You can experiment with the /examples/second_simple_example.m to see how to extend this experiment to a
multiprocessor environment.