M. Soliński, J. Gierałtowski, J. Żebrowski, “Modeling heart rate variability including the effect of sleep stages”, Chaos 26, 023101 (2016).
Please cite the above publication when referencing this material, and also include the standard citation for PhysioNet:
This model of heart rate variability is based on the two main assumptions: the dominating component of heart rate variability is random and that sleep architecture has a significant effect on HRV. We retained the stochastic properties of RR interval time series of the model by Kantelhardt et al.—the starting point in creating our model [1]. Human sleep architecture (the hypnogram) was simulated using our own method based on 30 real EEG recordings (database of the Faculty of Psychiatry, Warsaw University of Medicine, Warsaw, Poland) considering two properties of sleep architecture: the probabilities of transitions between all possible pairs of sleep stages and the probability distributions of sleep stage durations. The matrices of transitions probabilities with the percentage of the occurrence of the sleep stages in the complete time series are shown in Table 1.
| I half of sleep — matrix of probability | ||||||
|---|---|---|---|---|---|---|
| Sleep stage | L | D | REM | W | EXC | Sleep stage occurrence [%] |
| L | — | 0,478 | 0,049 | 0,052 | 0,422 | 59,3 |
| D | 0,752 | — | 0,000 | 0,017 | 0,221 | 27,6 |
| REM | 0,760 | 0,000 | — | 0,119 | 0,121 | 4,9 |
| W | 0,049 | 0,000 | 0,89 | — | 0,060 | 5,4 |
| Exc | 0,484 | 0,038 | 0,301 | 0,177 | — | 2,7 |
| II half of sleep — matrix of probability | ||||||
| Sleep stage | L | D | REM | W | EXC | Sleep stage occurrence [%] |
| L | — | 0,222 | 0,092 | 0,113 | 0,573 | 66,5 |
| D | 0,776 | — | 0,020 | 0,041 | 0,163 | 10,8 |
| REM | 0,691 | 0,003 | — | 0,182 | 0,124 | 7,6 |
| W | 0,087 | 0,000 | 0,803 | — | 0,110 | 12,1 |
| Exc | 0,386 | 0,000 | 0,364 | 0,250 | — | 3,0 |
Table I. Probability matrices of transitions between all possible pairs of sleep stages, together with the percent of occurrence of the sleep stages in the complete time series. The upper part of the table presents the probabilities for the first half of the sleep, the lower for the second half. As expected, the results for the first and the second half are clearly different, especially for the transitions between the sleep stages: L to D, L to REM, L to W, and L to Exc. We also observe differences in the percent of occurrence of the sleep stages for deep sleep, REM, and wake states. The transition probabilities between the pairs of stages REM and D, W and D, D and L, REM and Exc, and also the percent of occurrence of L and Exc generally do not change during sleep.
We considered several combinations of additional components introducing into the model, e.g., the strength of the effect of breathing on the heart rate simulated using the inverse Fourier transform of a series obtained from a pre-specified power spectrum (based on McSharry et. al model [2]), the variability of the model parameters, patterns of the shortening of the RR interval lengths during exercise periods during sleep, and smoothing out the transitions between sleep stages. That whole set of elements, often very easy to implement, provides to generate synthetic signals which are indistinguishable from the real data using either standard or nonlinear (including Multiscale Multifractal Analysis method [3]) heart rate variability measurements. The model was tested by using 34 RR time series from Institute of Cardiology, Warsaw, Poland each extracted from the nighttime part of Holter recordings [4]. Examples of real and generated by our model RR time series are shown in Figure 1.
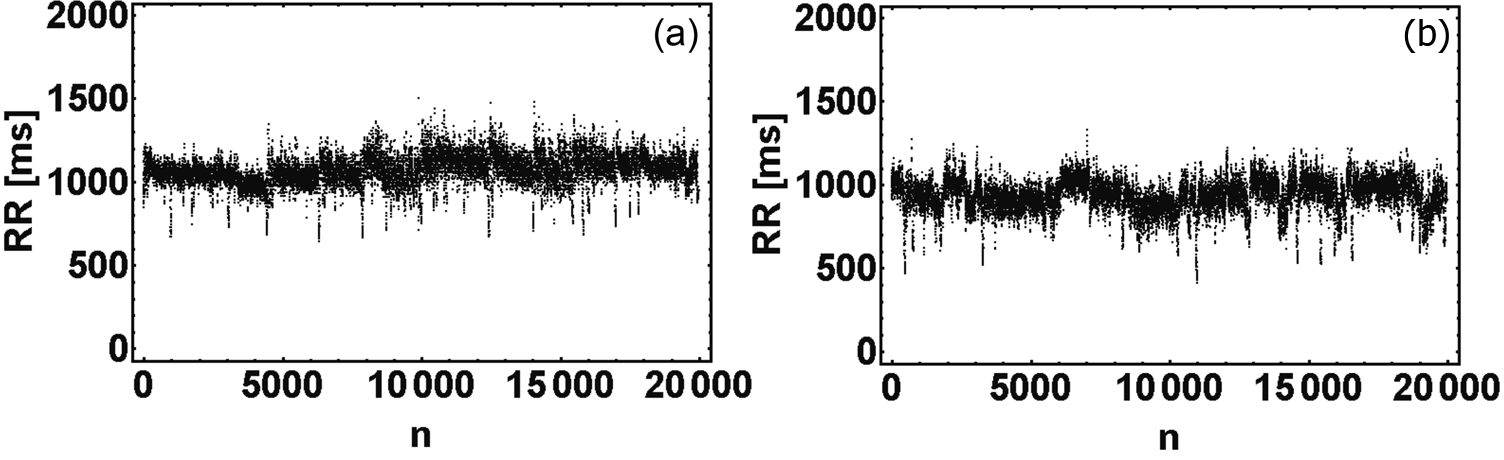
Figure 1: RR time series obtained for the real data (a) and from our model (b). The characteristic fuzzy structure of the upper envelope, visible in the signals from our model and in real data, reflects human sleep architecture.
One of the strengths of this model is the easy to interpret parameters that define the sleep architecture (i.e., the probability of transitions between the sleep phases). Variation of their values allows to simulate cases of sleep disorders (e.g., sleep apnea and insomnia) and even impossible or rare structures of sleep architecture, e.g., sleep without REM or deep stage, sleep with many transitions to wake stage, etc., as well.
The Matlab code, NightTimeHRVmodel.m, in this directory contains function generates RR time interval series. Function name: NightTimeHRVmodel .
Usage
Usage example:
NightTimeHRVmodel(n,nos,ifplot)
where n is number of samples of signal (default 25000),
nos is number of signals to generate (default 1) and
ifplot parameter enable/disable plotting of generated
signals (signals are plotted when ifplot =1). The output as .txt
files included RR time series and (optionaly) .png plots are storage
at a folder “. /RR” placed in the same directory as Matlab script.
Example data
The .zip archive HRVmodelExample.zip contains 20 RR time series generated by the model. Each signal is 25,000 samples length. The values of RR time intervals (in ms unit) are stored in .txt files . Additionally, .png picture with tachogram and hypnogram is joined to each recording . The files are created according to the default output option of the Matlab script NightTimeHRVmodel.m
Acknowledgements
The authors would like to thank their colleagues from the Cardiovascular Physics Group at the Faculty of Physics of Warsaw University of Technology for support. Special thanks go to Gari Clifford from Emory University and Georgia Institute of Technology for sharing uploaded version of HRV model by McSharry and Clifford. Thanks also to the following physicians for providing the medical data: Rafał Baranowski, Aleksander Prejbisz, Marek Kabat, and Andrzej Januszewicz from The Cardinal Stefan Wyszyński Institute of Cardiology, Warsaw, Poland, and Anna Piotrowska and Waldemar Szelenberg from the Faculty of Psychiatry, Warsaw University of Medicine, Poland.
References:
- [1] J. W. Kantelhardt, S. Havlin, and P. Ch. Ivanov, “Modeling transient correlations in heartbeat dynamics during sleep,” Europhys. Lett. 62, 147–153 (2003).
- [2] P. E. McSharry, G. Clifford, L. Tarassenko, and L. A. Smith, “Method for generating an artificial RR tachogram of a typical healthy human over 24 h,” Comput. Cardiol. 29, 225–228 (2002).
- [3] J. Gierałtowski, J. J. Żebrowski, and R. Baranowski, “Multiscale multifractal analysis of heart rate variability recordings with a large number of occurrences of arrhythmia,” Phys. Rev. E 85, 021915 (2012).
- [4] M. Soliński, J. Gierałtowski, J. J. Żebrowski, “Modeling heart rate variability including the effect of sleep stages”, Chaos 26, 023101 (2016).
 Name                    Last modified      Size  Description Parent Directory                             -
 HRVmodelExample.zip     2016-03-04 17:22  1.9M
 NightTimeHRVmodel.m     2016-03-04 17:22   16K
|
If you would like help understanding, using, or downloading content, please see our Frequently Asked Questions. If you have any comments, feedback, or particular questions regarding this page, please send them to the webmaster. Comments and issues can also be raised on PhysioNet's GitHub page. Updated Friday, 28 October 2016 at 16:58 EDT |
PhysioNet is supported by the National Institute of General Medical Sciences (NIGMS) and the National Institute of Biomedical Imaging and Bioengineering (NIBIB) under NIH grant number 2R01GM104987-09.
|