Next: The signal list Up: Analyzing Data with WAVE Previous: Defining a region of interest
Generating a heart rate signal is simple enough, given a beat annotation file and tach, a program supplied as part of the WFDB Software Package. tach reads an annotation file, calculates an instantaneous heart rate for each cardiac cycle from the reciprocal of the interval between successive beat annotations, and then uniformily resamples this signal (by default, at 2 Hz). Referring to the WFDB Applications Guide, we find the command we need to generate a heart rate signal from `100s.qrs':
tach -r 100s -a qrs -f 0 -t 1:0
If this command is typed into the Analysis Commands window, it prints:
    73.9726
    73.9726
    73.7238
       .
       .
       .
    75.7788
    74.5703
    73.8015
These numbers are the calculated samples of the heart rate signal (the units
are beats per minute).
We can generalize this command as:
tach -r $RECORD -a $ANNOTATOR -f $START -t $END
where the parameters $RECORD, $ANNOTATOR, etc., are replaced by
the appropriate values when the command is executed. This is the form of the
command we should add to WAVE 's menu; by parameterizing the arguments
in this way, we can use WAVE to select a record, annotator, and segment
to be analyzed as for the other commands in the menu. To add this command
to the menu, click on
Heart rate<TAB>tach -r $RECORD -a $ANNOTATOR -f $START -t $ENDwhere <TAB> represents one or more TAB characters; at least one TAB must be present (spaces don't count). Be sure to end the line with RETURN. Save the menu (choose Save from the textedit window's
You might prefer to look at heart rate as a signal rather than as a column of
numbers. tach has the capability of generating an output signal file
instead of text. To try this out, edit the menu file again, and add `-o
hr_$RECORD' to the end of the entry. (You may split the command across two
lines using a `![]() ' at the end of the first line if you wish.)
Once again, save the menu file, quit from textedit, click on
' at the end of the first line if you wish.)
Once again, save the menu file, quit from textedit, click on
![]() , and on
, and on
![]() . This time, there is no text
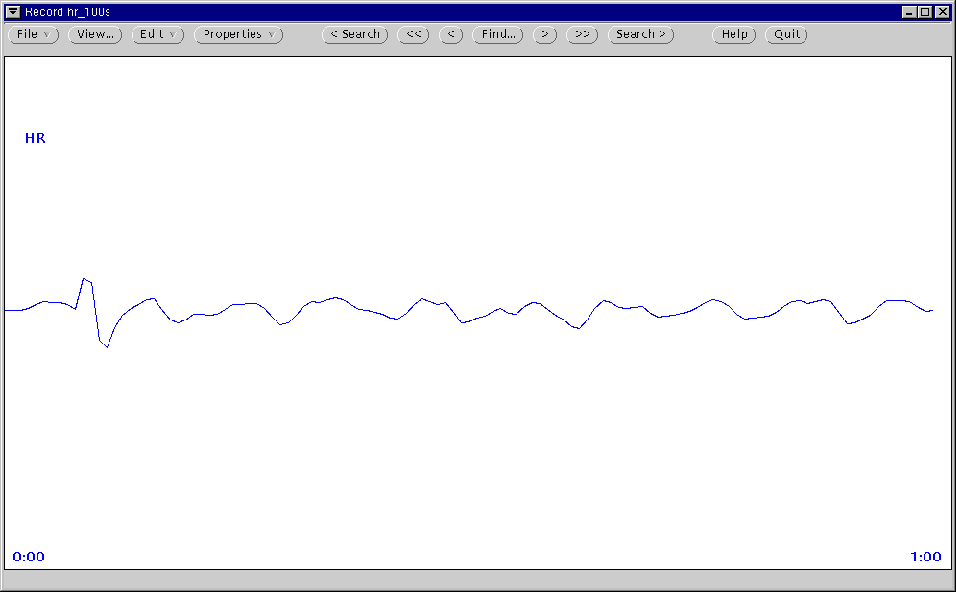
output from tach; if you enter `hr_100s' in the Record
field of the Load window, however, WAVE displays the calculated
heart rate signal.
. This time, there is no text
output from tach; if you enter `hr_100s' in the Record
field of the Load window, however, WAVE displays the calculated
heart rate signal.
George B. Moody (george@mit.edu)