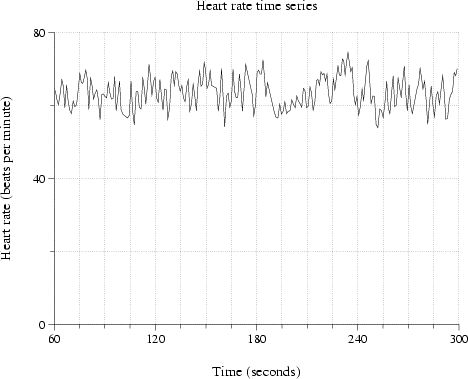
As you may have noticed, plt chose appropriate ranges for the x and y axes based on the ranges of x and y values in its input. Often, you may wish to specify the axis ranges, however, particularly if several plots are to be compared (in which case the plots should be prepared with the same scales and axis ranges). The next version of our plot, shown in figure 2.5, illustrates the -xa and -ya options for setting up the axes:
plt heartrate.data -t "Heart rate time series" \
  -x "Time (seconds)" -y "Heart rate (beats per minute)" \
  -xa 60 300 15 - 4 0 -ya 0 80 20 -g grid,sub
The -xa and -ya options each take an argument list containing up to six arguments. In this example, the argument list for -xa is ``60 300 15 - 4 0'', and that for -ya is ``0 80 20'' (plt recognizes -g as another option, rather than as part of -ya's argument list, because -g consists of a hyphen followed by a letter).
The first two arguments following -xa and -ya specify the x and y axis ranges. Notice that the x axis range (60 to 300) excludes a number of the points at the beginning of the data file. If you try this command, plt will warn you (by printing a message in your terminal emulator window) that points were excluded from the plot; note that there is no indication of this on the plot itself, however.
The third argument following each of -xa and -ya specifies the interval between axis ticks (in the units of the data). We have chosen 15 units for the x axis tick interval, since the x units are seconds and this allows us to arrange for a numbered tick at the beginning of each minute (the 4 following -xa specifies that every fourth tick is to be numbered).
The ``-'' between the 15 and the 4 is an example of a default argument. In most cases, where plt expects an argument, it will choose a reasonable default if you provide ``-'' instead of a specific value. The value that ``-'' replaces in this case is a format string that can be used to control how the numbered x axis ticks are printed. Note that, as in the argument list for -ya in this example, it is also usually acceptable to omit arguments at the end of a list if plt's defaults are acceptable to you. For further details on using the -xa and -ya options, see chapter 5.
The -g option and its argument (grid,sub) specifies that plt should draw gridlines across the plot at every axis tick. See chapter 12 for details about using -g to control the appearance of the grid.