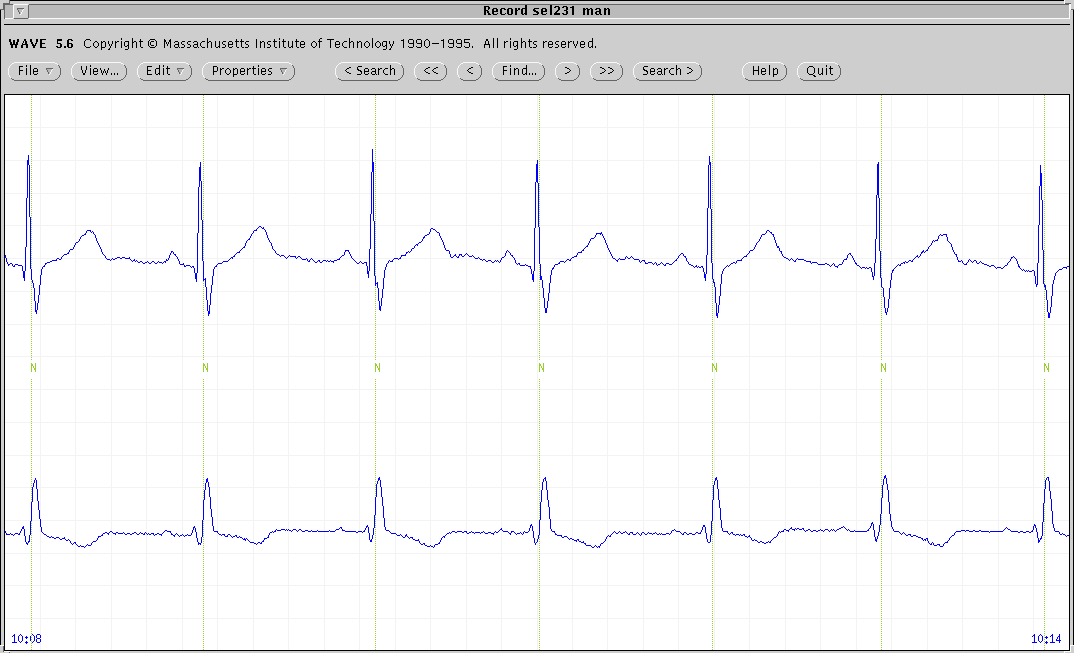
Manual annotations were made by two experts using a SUN workstation
using WAVE[3]. The extraction of the
annotation file which contains the QRS annotations was made
automatically, generating the record.man annotation file.
Each expert added estimated waveform boundaries to a copy of the record.man file. In this way we have for each record two
manual annotation files denoted by record.qtn, where
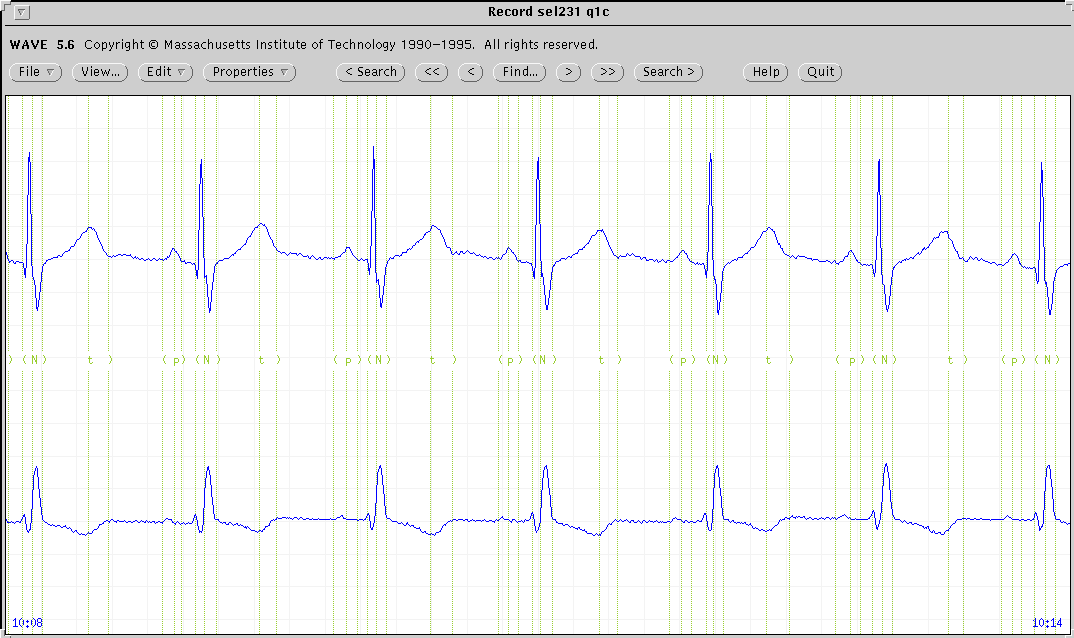
n=1,2 denotes expert who performed the annotations. A screen
similar to that shown shown in Fig. 1 was presented to the
expert annotators to support the editing process. Both leads were
displayed simultaneously, and then a decision was made about the time
location of the fiducial point. Fiducial points were marked by a
`![]() ' symbol, movable by a cursor, and the times were added to the
annotation file. These annotations were audited to correct the
inconsistencies detected (e.g., misplaced or missing annotations) and
changed to the regular annotation symbols `(' ,`)', `t', `p', and `u',
to produce the record.qnc files, containing
the final manual annotations. For 11 records the procedure was
repeated for a second annotator (n=2).
' symbol, movable by a cursor, and the times were added to the
annotation file. These annotations were audited to correct the
inconsistencies detected (e.g., misplaced or missing annotations) and
changed to the regular annotation symbols `(' ,`)', `t', `p', and `u',
to produce the record.qnc files, containing
the final manual annotations. For 11 records the procedure was
repeated for a second annotator (n=2).
 |