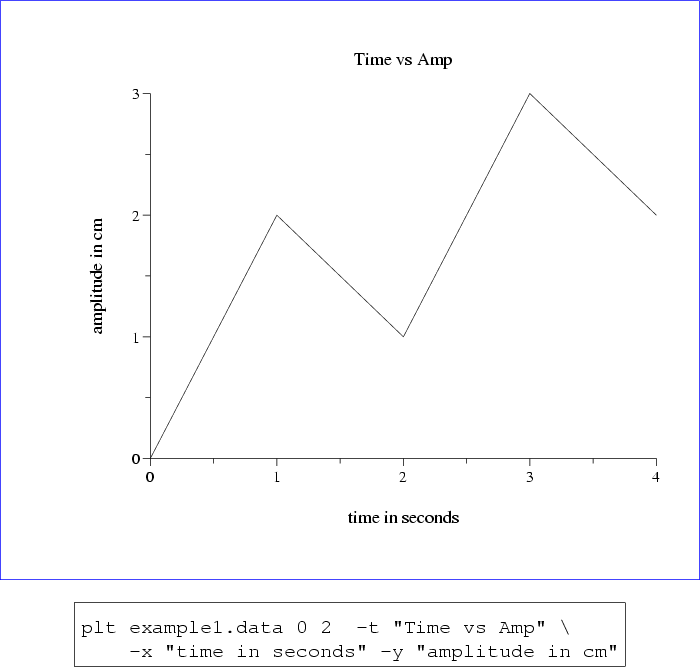
By now you should know how to make a simple plot of data as in the previous examples. You are now ready to label your plot. Using the -x and -y options, you can label the x and y axes respectively. Using the -t option, you can give your plot a title. Figure 5.1 demonstrates the use of these options.
plt example1.data 0 2  -t "Time vs Amp" \
    -x "time in seconds" -y "amplitude in cm"
Note that the data file name and the column numbers should immediately follow ``plt''.
With the -xa (x axis) and -ya (y axis) options, you can specify min and max (the endpoints of your axes), tick (how often you want tick marks to appear), fmt (the format in which to print the numbers, e.g., %.3f, %.2e), tskip (how often to skip when labelling the ticks, and cross (where you want the axis you are specifying to cross the other axis, in units of the other axis). If you do not need to change the default ticks and axis crossing points, the -X and -Y options accept axis endpoint arguments only. These options take their arguments as follows:
-xa xmin xmax tick fmt tskip ycross
-ya ymin ymax tick fmt tskip xcross
-X xmin xmax
-Y xmin xmax
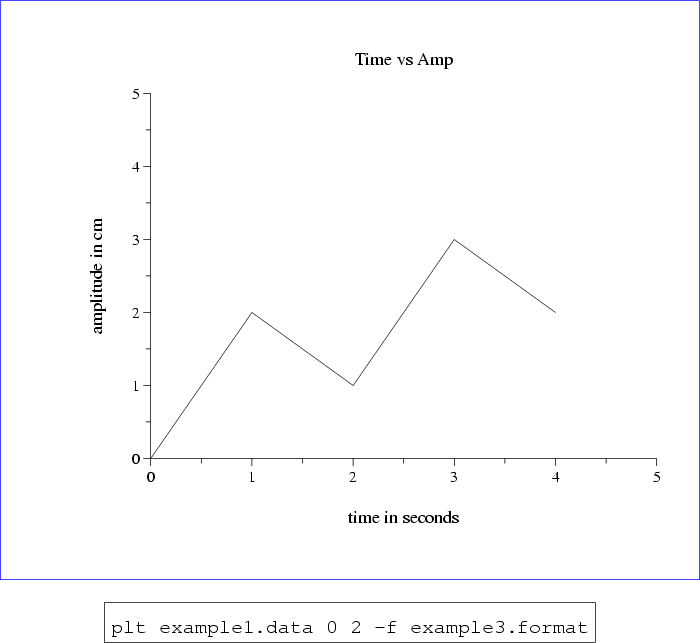
Figure 5.2, on page ![[*]](crossref.png) ,
demonstrates how -xa and -ya are used, and also the use of
the -f option with a format file. The format file, named example3.format, looks like this:
,
demonstrates how -xa and -ya are used, and also the use of
the -f option with a format file. The format file, named example3.format, looks like this:
t Time vs Amp
x time in seconds
y amplitude in cm
xa 0 5 .5 - 2 0
ya 0 5 .5 - 2 0
As for the data file, the name of the format file, including the suffix if any, is completely arbitrary. Note that each option within the format file (in this example, t, x, y, xa, and ya) must be given without an initial ``-'', but that a ``-'' in place of an option argument will cause plt to choose its own ``suitable value'' for that argument. Either a number based on the size of the plot and data limits will be chosen, or plt will use a default value in place of the ``-'' argument.
plt offers a large number of options that give you control over
virtually every aspect of how axes are drawn and labelled; these are
described in chapter 12, beginning on page .