


Next: Modifications and Extensions
Up: Source Code
Previous: Source Code
Flowchart and Functions
The source code is based on the MATLAB function simulate.m. The
input arguments to simulate.m include the desired parameter
values characterizing the human cardiovascular model and its
execution, while the outputs are the simulated data - all pressures
( ), volumes (
 ), flow rates (
 ), ventricular
elastances
), ventricular
elastances  , adjustable parameters (
 ), cardiac
function/venous return curves (
), cardiac
function/venous return curves ( ), and ventricular
contraction times (
), and ventricular
contraction times ( ). This function may also write the simulated
data to file (with a desired prefix file name also provided as an
input argument) and display the data as they are being calculated.
The function is responsible for executing the models described in
Section 2 as well as in Appendix A. However,
the flowchart of Figure 7 depicts how the function
simulates the data from the desired parameter values characterizing
only the models of Section 2. The pertinent details of
each block of the flowchart are provided below.
). This function may also write the simulated
data to file (with a desired prefix file name also provided as an
input argument) and display the data as they are being calculated.
The function is responsible for executing the models described in
Section 2 as well as in Appendix A. However,
the flowchart of Figure 7 depicts how the function
simulates the data from the desired parameter values characterizing
only the models of Section 2. The pertinent details of
each block of the flowchart are provided below.
Figure 7:
Flowchart of the MATLAB function simulate.m.
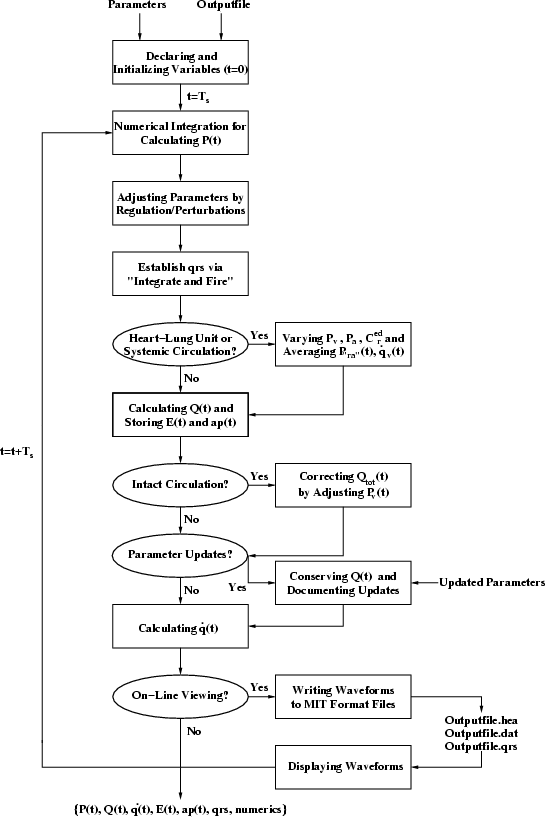 |
- Declaring and Initializing Variables (t=0). With the
desired parameter values provided as function input arguments, all
variables of the simulation are declared and initialized. Memory is
pre-allocated for all of the data to be simulated over their entire
integration period in order to increase execution speed with the
MATLAB compiler. The respiratory-related waveforms are pre-computed
over the entire integration period.
- Numerical Integration for Calculating . The
pressures of the desired model of the pulsatile heart and
circulation are calculated at the current time step (
 ) from
the pressures at the previous time step (
) from
the pressures at the previous time step ( ) by fourth-order
Runge-Kutta integration of the set of ordinary differential
equations governing the model.
) by fourth-order
Runge-Kutta integration of the set of ordinary differential
equations governing the model.  must be set to
  0.005 s
for reasonable accuracy.
0.005 s
for reasonable accuracy.
- Adjusting Parameters by Regulation/Perturbations.
Parameters of the pulsatile heart and circulation are adjusted by
the short-term regulatory system and resting physiologic
perturbations models. Because of the relatively narrow bandwidths
of these models, the parameter adjustments are calculated at a
sampling period of 0.0625 s. First, the requisite waveforms
originally computed at a sampling period of are decimated to a
sampling period of 0.0625 s by averaging over the past 0.25 s every
0.0625 s. Then, the mandated parameter adjustments are computed at
a sampling period of 0.0625 s. Finally, the mandated parameter
adjustments are converted to a sampling period of via linear
interpolation (with the exception of the adjustments to
 which do not take effect until the initiation of the
next ventricular contraction) in order to compute the subsequent
waveforms.
which do not take effect until the initiation of the
next ventricular contraction) in order to compute the subsequent
waveforms.
- Establishing qrs via``Integrate and Fire.'' The mandated
changes to
 are mapped to the times of onset of ventricular
contraction by integrating (in units of bps) over time until
the integral is equal to one. Then, systole is initiated by
resetting the variable, ventricular elastance model, the integral is
set to zero, and the integration is repeated.
are mapped to the times of onset of ventricular
contraction by integrating (in units of bps) over time until
the integral is equal to one. Then, systole is initiated by
resetting the variable, ventricular elastance model, the integral is
set to zero, and the integration is repeated.
- Heart-Lung Unit or Systemic
Circulation?
 Varying
  ,
,
 ,
,  and Averaging
 ,
,
 . Cardiac function or venous return curves are
generated, if desired. Following every fifth beat, and
are varied in steps for generation of cardiac function curves, and
is varied for simulation of venous return curves.
Time-averaged
and
and
(for cardiac function curves) are recorded over the beat preceding
the step variation.
. Cardiac function or venous return curves are
generated, if desired. Following every fifth beat, and
are varied in steps for generation of cardiac function curves, and
is varied for simulation of venous return curves.
Time-averaged
and
and
(for cardiac function curves) are recorded over the beat preceding
the step variation.
- Calculating and Storing and . The
blood volumes of each compartment of the desired model of the
pulsatile heart and circulation are computed at the current time
step from the pressures at the current time step, and the values of
the ventricular elastances and adjustable parameters at the current
time step are stored into their pre-allocated memory slots.
- Intact
Circulation?
Correcting
 by Adjusting
  . Total blood volume of the
intact pulsatile heart and circulation at the current time step
(
), which may vary due to integration error, is
conserved. The difference between the computed
and its
assigned value is added/removed from
. Total blood volume of the
intact pulsatile heart and circulation at the current time step
(
), which may vary due to integration error, is
conserved. The difference between the computed
and its
assigned value is added/removed from  and is
altered accordingly.
and is
altered accordingly.
- Parameter
Updates?
Conserving and
Documenting Updates. The parameter values of a simulation may be
updated after the initiation of each ventricular contraction by
pausing the simulation, updating the parameter values, and resuming
the simulation. The newly chosen parameter values are documented to
file if they are relevant to the current simulation, and the blood
volumes in each compartment at the current time step are conserved
by adjusting the pressures at the current time step (if necessary).
Adjustments to the respiratory-related waveforms are implemented for
the remainder of the integration period.
- Calculating
. The flow rates of the pulsatile
heart and circulation models are calculated at the current time step
from the pressures at the current time step.
- On-Line Viewing?
Writing
Waveforms to MIT Format
Files
Displaying Waveforms.
When viewing simulated data as they are being calculated, the
waveforms are periodically written to file in MIT format (with a
desired period). The newly written data are then immediately
displayed with WAVE.
The flow of each of the blocks is then repeated starting at Numerical Integration for Calculating with  . In
order to execute the blocks in the flowchart, simulate.m calls
upon many MATLAB and C functions, each of which are briefly described
below.
. In
order to execute the blocks in the flowchart, simulate.m calls
upon many MATLAB and C functions, each of which are briefly described
below.
- intact_init_cond.m computes the initial pressures,
volumes, and flow rates of the intact pulsatile heart and
circulation model from the desired parameter values. The initial
values are determined from the solution of a linear system of
equations which are derived from the application of steady-state
conservation laws to a linearized version of the model.
- hlu_init_cond.m computes the initial pressures, volumes,
and flow rates of the heart-lung unit preparation model from the
desired parameter values. The initial values are determined from
the solution of a linear system of equations which are derived from
the application of steady-state conservation laws to a linearized
version of the model.
- sc_init_cond.m computes the initial pressures, volumes,
and flow rates of the systemic circulation preparation model from
the desired parameter values. The initial values are determined
from the solution of a linear system of equations which are derived
from the application of steady-state conservation laws to a
linearized version of the model.
- rk4.m computes the pressures of the pulsatile heart and
circulation (any preparation) at the current time step from the
pressures of the previous time step, the current values of the
parameters, respiratory-related waveforms, and time surpassed in the
current cardiac cycle according to fourth-order Runge-Kutta
integration.
- intact_eval_deriv.m is called only by rk4.m and
computes the derivative of the intact pulsatile heart and
circulation pressure values at a desired time step which is
necessary for the fourth-order Runge-Kutta integration.
- hlu_eval_deriv.m is called only by rk4.m and
computes the derivative of the heart-lung unit preparation pressure
values at a desired time step which is necessary for the
fourth-order Runge-Kutta integration.
- sc_eval_deriv.m is called only by rk4.m and
computes the derivative of the systemic circulation preparation
pressure values at a desired time step which is necessary for the
fourth-order Runge-Kutta integration.
- var_cap.m is also called by intact_eval_deriv.m,
hlu_eval_deriv.m, and sc_eval_deriv.m and computes a
ventricular elastance value as well as its derivative at a desired
time step from the current values of
,
 ,
the previous cardiac cycle length, and the time surpassed in the
current cardiac cycle.
,
the previous cardiac cycle length, and the time surpassed in the
current cardiac cycle.
- vent_vol.m is also called by intact_eval_deriv.m,
hlu_eval_deriv.m, and sc_eval_deriv.m and computes the
current ventricular blood volume from the current ventricular
pressure according to Newton's search method with an initial guess
given by the previous ventricular blood volume.
- rand_int_breath.m computes the time until the next
respiratory cycle commences based on the outcome of an independent
probability experiment.
- resp_act.m computes the respiratory-related waveforms
(
 ,
,  ,
,
 , and
, and
 ) over the entire integration period from the parameter
values and the times of commencement of each respiratory cycle.
) over the entire integration period from the parameter
values and the times of commencement of each respiratory cycle.
- ilv_dec.m decimates to a sampling period
equal to 0.0625 s. This decimated waveform is convolved with the
filter created by dncm_filt.m (see below) in order to
establish the changes in mandated by the direct neural
coupling mechanism.
- dncm_filt.m generates a filter which characterizes the
direct neural coupling mechanism between and .
- bl_filt.m generates a lowpass filter with a narrow
transition band (truncated sinc function of unit-area) and desired
cutoff frequency which is utilized to bandlimit the exogenous
disturbance to
 .
.
- oneoverf_filt.m generates a filter with a 1/f
 magnitude-squared frequency response over a
desired frequency range (in decades) and at a desired sampling
period (see below).
magnitude-squared frequency response over a
desired frequency range (in decades) and at a desired sampling
period (see below).
- ans_filt.m creates a filter which is a linear
combination of
 and
and  . This filter is convolved with
the filter generated by oneoverf_filt.m and then white
noise in order to create the exogenous disturbance to .
. This filter is convolved with
the filter generated by oneoverf_filt.m and then white
noise in order to create the exogenous disturbance to .
- abreflex.m computes the parameter adjustments mandated
by the arterial baroreflex system based on the current setpoint
and static gain values.
- cpreflex.m computes the parameter adjustments mandated
by the cardiopulmonary baroreflex system based on the current
setpoint and static gain values.
- param_change.m determines whether the parameter updates
are relevant to the status of the current simulation based on the
current parameter values, the previous parameter values, and the
status parameters (see Section 5.2).
- conserve_vol.m computes the pressures at the current
time step necessary to conserve the blood volume in each
compartment at the current time step when parameter values are
updated.
- read_param.m reads a file which contains the parameters
values of the cardiovascular model and its execution in a specific
format and stores the values in a MATLAB vector.
- read_key.c reads the standard input, pauses the
simulation if a ``p'' is entered followed by
 RETURN
 , and
resumes the simulation if a ``r'' is entered followed by
RETURN.
, and
resumes the simulation if a ``r'' is entered followed by
RETURN.
- write_param.c copies the parameter file to a new file
of the same name but with the extension .num. This function
is implemented when the parameter update occurs. The extension is
set equal to the number of parameter updates that have been made
during the simulation period.
- wave_remote.c plots the desired simulated waveforms and
annotations with the WAVE display system. This function is called
when the simulated data are written to file in MIT format and
plots the most recent desired window of written data.
The function simulate.m is called by a wrapper function rcvsim.m for execution at the Linux prompt. This wrapper function
takes two command line arguments: 1) the name of a file containing the
desired parameter values and 2) the prefix name of the output files to
be generated in MIT format. The function rcvsim.m, which also
includes a help option, reads in the parameter file with read_param.m (see above), creates a header file in MIT format,
executes simulate.m, writes the simulated data to MIT format
files if the on-line viewing option is not chosen, and displays
cardiac function and venous return curves, if desired, with the
function plot_cfvr.c (which employs Gnuplot). In order to
execute rcvsim.m, the function must be compiled with the file
make.m which creates the binary file rcvsim. The function
simulate.m may also be compiled independently of rcvsim.m
with the file makem.m which creates the binary file simulate.mexlx (in the Linux environment). Each of these make
files greatly improve execution speed specifically through mcc
(MATLAB compiler) optimization arguments r (real numbers only)
and i (no dynamic memory allocation). Note that simulate.m may only be executed in the MATLAB environment without
on-line viewing and parameter updating capabilities.
Next: Modifications and Extensions
Up: Source Code
Previous: Source Code
Ramakrishna Mukkamala (rama@egr.msu.edu)
2004-02-03