In the first release of the MIMIC II database (January 2009) there are
26,655 patients (with unique Subject_ID's) of which 19,075 were
adults (defined to be ![]() years old at time of last admission)
and 6,538 were neonates (
years old at time of last admission)
and 6,538 were neonates (![]() month old at the time of first
admission1.1), These patients experienced a total
of 29,545 hospital admissions
(22,916 adults and 6,585 neonates). However, there were only 29,505
ICU-related hospital admissions (with 22,880 for adults and 6,582 for
neonates). That is, a small fraction of the patients was admitted but
never made it to the ICU for various reasons.
month old at the time of first
admission1.1), These patients experienced a total
of 29,545 hospital admissions
(22,916 adults and 6,585 neonates). However, there were only 29,505
ICU-related hospital admissions (with 22,880 for adults and 6,582 for
neonates). That is, a small fraction of the patients was admitted but
never made it to the ICU for various reasons.
| Category | Code Range | Number of | %
|
|---|---|---|---|
| Ischemic heart disease | 410 - 414 | 4084 | 17.85% |
| Trauma | 800 - 959 | 2337 | 10.21% |
| Digestive disease | 520 - 579 | 2228 | 9.74% |
| Pulmonary disease | 460 - 519 | 2070 | 9.05% |
| Infectious diseases | 001 - 139 | 1603 | 7.01% |
| Neoplasms | 140 - 239 | 1562 | 6.83% |
| Cerebrovascular disease | 430 - 438 | 1426 | 6.23% |
| Other forms of heart disease | 420 - 429 | 1367 | 5.97% |
| Arteries and veins | 440 - 459 | 783 | 3.42% |
| Complications peculiar to certain specified procedures | 996 | 674 | 2.95% |
| Heart failure | 428 | 656 | 2.87% |
| Metabolic disorder | 240 - 279 | 634 | 2.77% |
| Renal insufficiency | 580 - 629 | 448 | 1.96% |
| Poisoning | 960 - 989 | 356 | 1.56% |
| Other complications of procedures, NEC | 998 | 349 | 1.53% |
| Chronic rheumatic heart disease | 393 - 398 | 300 | 1.31% |
| Symptoms, signs, and ill-defined conditions | 780 - 799 | 271 | 1.18% |
| Neurologic disease | 320 - 389 | 255 | 1.11% |
| Diseases of the musculoskeletal system & connective tissue | 710 - 739 | 247 | 1.08% |
| Diseases of pulmonary circulation | 415 - 417 | 175 | 0.76% |
| Mental disorders | 290 - 319 | 153 | 0.67% |
| Congenital anomalies | 740 - 759 | 153 | 0.67% |
| Complications affecting specified body systems, not elsewhere classified | 997 | 150 | 0.66% |
| Complications of pregnancy, childbirth, & puerperium | 630 - 677 | 145 | 0.63% |
| Hypertensive disease | 401 - 405 | 142 | 0.62% |
| Supplementary classification of factors influencing health status and contact with health services | V01 - V86 | 92 | 0.40% |
| Diseases of the blood and blood-forming organs | 280 - 289 | 88 | 0.38% |
| Diseases of the skin and subcutaneous tissue | 680 - 709 | 64 | 0.28% |
| Other and unspecified effects of external causes | 990 - 995 | 54 | 0.24% |
| Without primary ICD9 code | 6 | 0.03% | |
| Complications of medical care, not elsewhere classified | 999 | 6 | 0.03% |
| Acute Rheumatic fever | 390 - 392 | 2 | 0.01% |
| Total | 22,880 | 100.00% | |
The total number of ICU stays (number of ICUstay_ID's) was 33,361 (25,852 for adults and for 7,302 neonates), giving an average of 1.25 hospital stays per patient; 1.36 for adults and 1.12 for neonates. Details on how to calculate these numbers are given in chapter 2. Of the adult population, 38% was from the MICU, 26% from the SICU, 20% from the CSRU and 15% from the CCU. 2,430 Case_ID's (with associated waveforms and trends) have been associated with unique patients (Subject_ID's) Although we have collected neonatal waveforms, these will likely be released at a later date when the associated clinical data has been matched and verified. The rest of the description of the data in this section is therefore limited to the adult population.
Table 1.1 lists the thirty-one major primary1.2 ICD-9 code categories for hospital admissions and the relative frequency for the adult patient population. Note that of the 22,916 adult hospital admissions (Hadm_ID), there was a total of 22,880 that were admitted to the ICU and therefore received ICD-9 codes. Note also that there are a range of codes associated with each condition. Furthermore, many non-primary codes are assigned to each ICU-related hospital admission with an average of 9 codes per admission. Table 6.1 in appendix 6.4 lists the frequency of all the ICD-9 codes (including the primary codes).
|
|
|
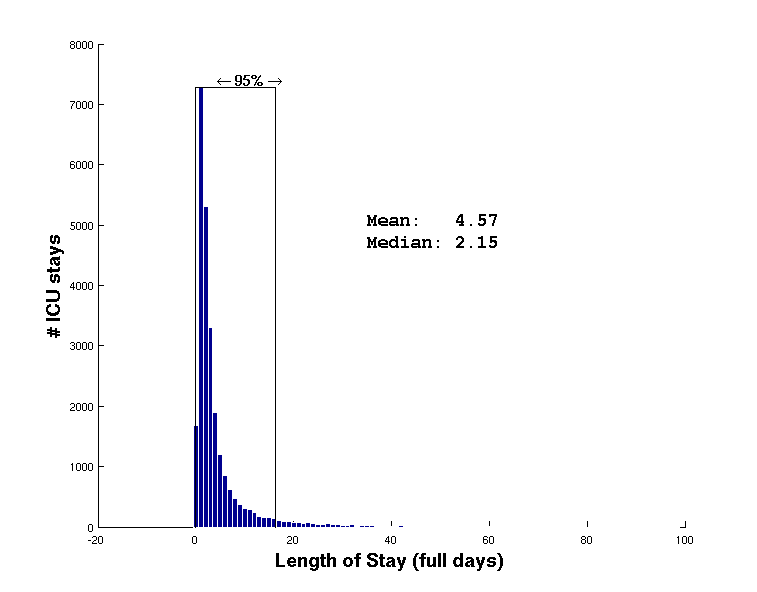
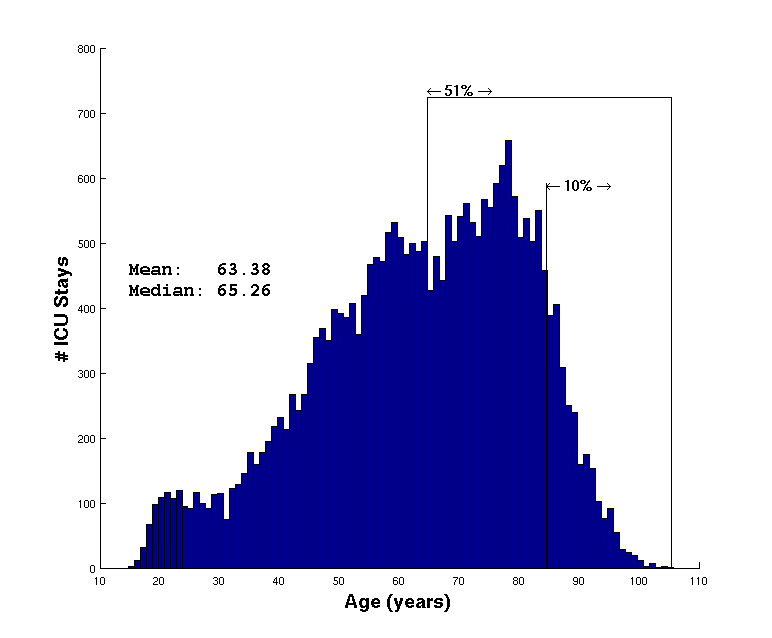
Figure 1.8 illustrates the age distribution of adult patients at the time of each ICU stay (N=25,852). Therefore, a patient will be represented more than once if they were admitted to the ICU more than once. The mean age at time of admission was 63.44 years and the median age was 65.33 years. Note small drops in admission rates for patients during their mid 20's to mid 30's, and again around 65 years of age. The distribution of length of stay for each ICU admission is illustrated in figure 1.9. Note that the distribution is heavy tailed, with a mean of 4.57 days and a median of only 2.15 days.
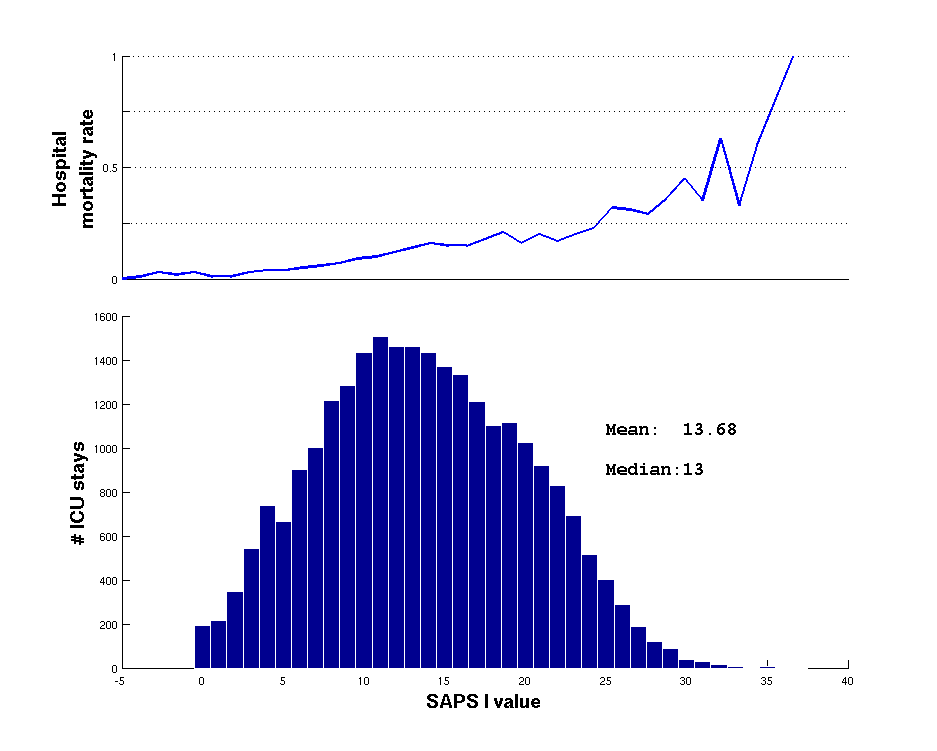
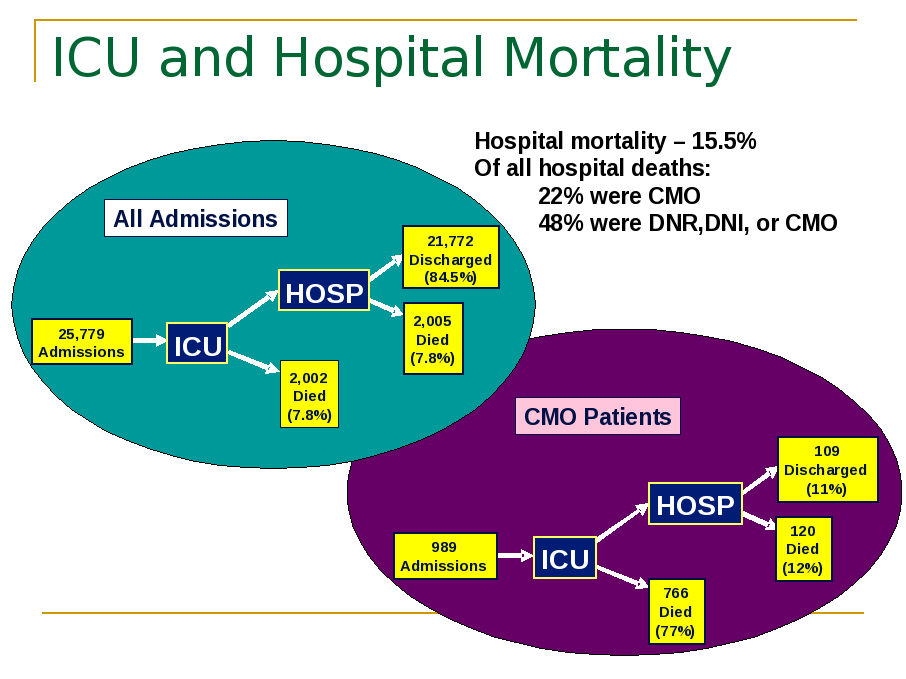
Figure 1.10 illustrates the distribution of patients' Simplified Acute Physiology Score (SAPS I) at each admission (lower plot) and the associated hospital mortality rate1.3 (upper plot). Note that the mortality rate begins to climb steeply around a SAPS I value of 23. Although the mortality rate begins to fluctuate wildly above this value, this is likely an artifact of low numbers. The mean SAPS I was 13.68 and the median was 13. Figure 1.11 illustrates how this mortality varies during a hospital stay by showing the percentage of patients in the MIMIC II database that die in the ICU, and after discharge to the floor (HOSP) for all admissions (upper left) and for the subset with CMO (Comfort Measures Only) (lower right). Notice that mortality curve as a function of SAPS 1 values is not perfectly smooth, particularly above a SAPS 1 value of 20. Above a SAPS 1 value of 30, the mortality rate fluctuates wildly, but this may be an artifact of the small numbers of individuals admitted with such a value.