The data were collected over a seven year period, beginning in 2001, from the Boston's Beth Israel Deaconess Medical Center (BIDMC). Any patient who was admitted to the ICU on more than one occasion may be represented by multiple patient visits. The adult ICUs (for patients aged 15 years and over) include medical (MICU), surgical (SICU), coronary (CCU), trauma (T-SICU), and cardiac surgery (CSRU) care units. Data were also collected from the neonatal ICU (NICU).
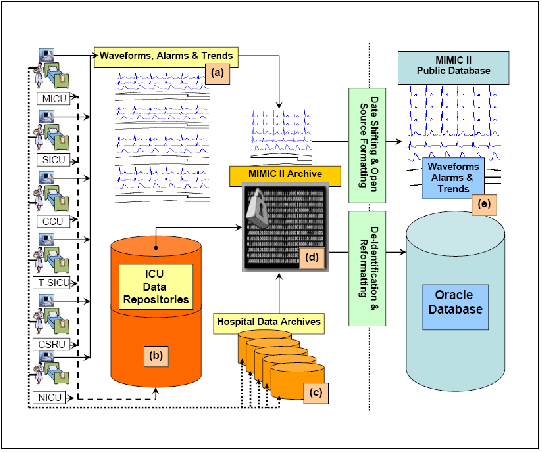
Figure 1.1 illustrates the data acquisition process, which did not interfere with the clinical care of patients, since databases were dumped off-line and bedside waveform data and derived trends were collected by an archiving agent over TCP/IP. Source data for the MIMIC II database consists of a) bedside monitor waveforms and associated numeric trends derived from the raw signals, b) clinical data derived from Philips' CareVue system, and c) data from hospital electronic archives. These data are assembled in a protected and encrypted database (both flat files for the waveforms and trends, and in the form of a relational database for all other data). Once the data have been assembled in a central repository and time aligned, the waveforms and trends for each individual are linked to the corresponding individual's data in the relational database. (See section 1.4.3 for more information.) The data are then de-identified to produce a final set of data for public consumption. (See section 1.4.4 and [6] for more information on this detailed process.)
The resulting records contain realistic patient measures with all the associated challenges (such as noise or missing data gaps) that advanced monitoring and clinical decision support systems (CDSS) algorithms would receive as input data. Noise and artifact examples in the database, together with methods for dealing with these problems are described in sections 1.6 and 5.4.
|
|
|