GB Moody
Harvard-M.I.T. Division of Health Sciences and Technology, Cambridge, MA, USA
Abstract
Standard methods of estimating the power spectral density (PSD) of irregularly sampled signals such as instantaneous heart rate (HR) require resampling at uniform intervals and replacement of unusable samples. The Lomb periodogram is a means of obtaining PSD estimates directly from irregularly sampled time series, avoiding these requirements. This paper compares Fourier, autoregressive, and Lomb PSD estimates from synthetic, real, and noise-corrupted real heart rate time series, and examines systematic differences among these estimates. An algorithm is presented for obtaining a heart rate time series suitable for Lomb PSD estimation from an RR interval time series with included ectopic beats and erroneous measurements. The paper concludes with a brief survey of other applications of the technique, such as estimation of respiratory frequency from a time series of beat-by-beat measurements of the mean electrical axis.
Introduction
Power spectral density estimation is a commonly-used analytic
technique for describing periodicities in time series. Most
non-trivial analyses of heart rate variability (HRV) depend on PSD
estimation. The instantaneous heart rate time series used as the
bases of these analyses are sampled at intrinsically irregular
intervals (if the RR intervals were uniform, there would be no HRV to
analyze). Standard methods for PSD estimation, including Fourier
transform (FT) and autoregressive (AR) methods, operate on time series
with uniform intervals between samples. To apply FT or AR techniques
to heart rate time series therefore requires that the series be
If the time series contains inappropriate or missing samples (as, for example, in heart rate time series with ectopic beats or noise), PSD estimates can be severely affected, since impulse noise in the time domain is transformed to broad-band ``clutter'' in the frequency domain. In such cases, resampling is further complicated by the need to infer probable values as replacements[4], with the likelihood of further alteration of frequency content[5]. For these reasons, some investigators analyze only segments free of ectopy and noise[6]; this approach runs the risk of introducing selection bias in HRV analysis, however, since both ectopy and noise are correlated with HRV-related factors such as physical activity.
Methods for PSD estimation based directly on irregularly sampled time series have been used, though not in HRV analysis, since at least 1976[7, 8]. Methods such as the Lomb periodogram entirely avoid the problems associated with resampling and sample replacement. The high computational burden of these methods has been a major obstacle to their general use[9] until recently. In 1989, Press and Rybicki published a fast algorithm for obtaining an arbitrarily accurate approximation to the Lomb periodogram[10, 11]. The remainder of this paper illustrates how the Lomb periodogram, obtained using the Press-Rybicki algorithm, may be applied to analysis of HRV and related signals.
Examples
Several HR time series are presented below, together with the corresponding Lomb, FT, and AR spectra. In each case, an irregularly sampled instantaneous heart rate (IHR) signal was obtained from an RR interval time series using the algorithm given in the appendix, and this signal was used as input to the Press-Rybicki algorithm to obtain the Lomb periodogram. A regularly sampled instantaneous heart rate signal[3] was obtained from the same RR series; this signal (five minutes in length in each case, and sampled at 2 Hz) was zero-meaned, detrended, zero-padded to a length of 1024 samples, and Welch windowed, and the result was used as input to standard fast Fourier transform (FT) and autoregressive model (AR) algorithms for PSD estimation[11]. In the examples shown here, the AR models are of order 24. The Lomb and AR spectra can be evaluated for any desired frequencies; for purposes of comparison, all spectra were evaluated at the discrete frequencies defined for the Fourier spectra.
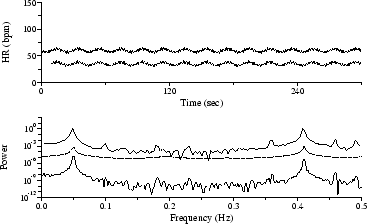
To demonstrate the essential similarity of FT, AR, and Lomb PSD estimates, synthesized HR time series are shown in Figures 1 and 2.
Figure 1: Synthesized HR time series and corresponding spectra (see text). In Figures 1-5, the upper trace is the resampled HR series used to derive the FT and AR spectra; below it is the IHR series (offset by 25 bpm for clarity) used to derive the Lomb spectrum. The lower panel shows, from top to bottom: the Lomb spectrum (heavy line); the AR spectrum (dotted line); and the FT spectrum (thin line). For clarity, the AR and FT spectra are offset by 103 and 106 units respectively.
![[Synthesized HR time series and corresponding spectra]](img3.png)
These five-minute sequences were generated using a recurrence of the form
|
|
(1) |
|
|
(2) |
where ![]() is the RR interval beginning at
is the RR interval beginning at
![]() ,
,
![]() is a
random variable evenly distributed between -1 and 1, and the remaining
parameters are arbitrary constants. For the simulation shown in
Figure 1, both
is a
random variable evenly distributed between -1 and 1, and the remaining
parameters are arbitrary constants. For the simulation shown in
Figure 1, both ![]() and
and
![]() are 0, so that the sequence
contains randomly-varying intervals with a mean of
are 0, so that the sequence
contains randomly-varying intervals with a mean of ![]() (1 second in
the simulations shown here). The Lomb periodogram of this
sequence is consistent with white noise, whereas the FT and AR spectra
show the high-frequency (HF) attenuation expected as a result of the
resampling process. In Figure 2,
(1 second in
the simulations shown here). The Lomb periodogram of this
sequence is consistent with white noise, whereas the FT and AR spectra
show the high-frequency (HF) attenuation expected as a result of the
resampling process. In Figure 2, ![]() and
and ![]() are equal and
larger than
are equal and
larger than ![]() ;
; ![]() and
and ![]() are chosen to
modulate the RR intervals at frequencies of 0.05 and 0.41 Hz, to
simulate sympathetically-mediated low frequency HR oscillations and
parasympathetically-mediated respiratory sinus arrhythmia. The
three spectra are quite similar, apart from the HF attenuation in
the FT and AR spectra, and the lack of detail/clutter in the AR spectrum.
are chosen to
modulate the RR intervals at frequencies of 0.05 and 0.41 Hz, to
simulate sympathetically-mediated low frequency HR oscillations and
parasympathetically-mediated respiratory sinus arrhythmia. The
three spectra are quite similar, apart from the HF attenuation in
the FT and AR spectra, and the lack of detail/clutter in the AR spectrum.
Figure 2: Synthesized HR time series and corresponding spectra (see text).
The sequence in Figure 3 was obtained by automated analysis of an ECG signal acquired from a subject with sleep apnea syndrome; the low frequency modulation of heart rate with a period of roughly 45 seconds matches the frequency of the subject's obstructive apneas. Although the spectral peak near 0.025 Hz is most obvious in the AR spectrum, it is also clearly visible in both the Lomb and the FT spectra, which also reveal the harmonically related peak near 0.05 Hz.
The sequence in Figure 4 was obtained by automated analysis of the same signal used in Figure 3, after addition of electrode motion artifact scaled to obtain a signal-to-noise ratio of 12 dB. Roughly 30 QRS detector errors resulting from the added noise are readily discernible in the time series. Although much of the sequence is rejected by the algorithm that prepares input for the Lomb periodogram, the peak near 0.025 Hz is still prominent, and the first harmonic also remains visible. The 0.025 Hz peak is visible but not significant among the clutter in the FT spectrum, and the AR spectrum has no significant features.
By rejecting the outliers and using a predictive interpolator to obtain replacement samples, as shown in Figure 5, the 0.025 Hz peak emerges as a broad feature in the AR spectrum, but the FT spectrum shows a broad, spurious peak at about 0.015 Hz.
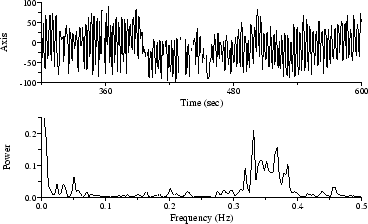
Other irregularly-sampled time series frequently appear in HRV-related studies. Among those amenable to Lomb PSD analysis are respiration intervals and tidal volumes, gait, and beat-by-beat systolic blood pressure measurements. As a final example, Figure 6 shows a time series of beat-by-beat measurements of the mean cardiac electrical axis, which fluctuates in response to respiration[12]; the Lomb spectrum clearly reveals the respiratory frequency.
Figure 3: HR time series and spectra during periodic obstructive apneas.
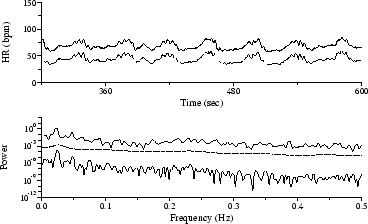
Figure 4: HR time series from Figure 3, corrupted by added noise, with corresponding spectra.
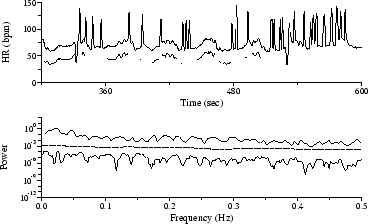
Figure 5: HR time series from Figure 4, corrected using a predictive interpolator, with corresponding AR and FT spectra.
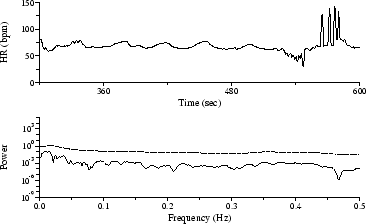
Figure 6: Electrical axis time series (above), with Lomb spectrum (below).
Conclusions
Lomb and FT spectra are derived using ![]() algorithms,
and AR spectra are derived using an algorithm that is only slightly
slower for reasonable choices of model order. The essential
similarity of the Lomb, FT, and AR spectra given ideal inputs,
considered in light of their similar computational demands, suggests
that there may be little reason to choose one over any other.
When considering the less-than-ideal inputs endemic to HRV studies,
however, only the Lomb method produces robust PSD estimates in the
presence of noise and ectopy. The Lomb method avoids all of the
complications and pitfalls of resampling and replacement of outliers,
and introduces no drawbacks of its own; in consequence, it is the
method of choice for PSD estimation of heart rate.
algorithms,
and AR spectra are derived using an algorithm that is only slightly
slower for reasonable choices of model order. The essential
similarity of the Lomb, FT, and AR spectra given ideal inputs,
considered in light of their similar computational demands, suggests
that there may be little reason to choose one over any other.
When considering the less-than-ideal inputs endemic to HRV studies,
however, only the Lomb method produces robust PSD estimates in the
presence of noise and ectopy. The Lomb method avoids all of the
complications and pitfalls of resampling and replacement of outliers,
and introduces no drawbacks of its own; in consequence, it is the
method of choice for PSD estimation of heart rate.
Acknowledgements
This work was supported in part by grants from the National Institute on Drug Abuse (P01-DA06316); the National Heart, Lung, and Blood Institute (R01-HL-42172); the National Aeronautics and Space Administration (NAG9-572); and the G. Harold and Leila Y. Mathers Charitable Foundation.
Bibliography
- 1
-
DeBoer RW, Karemaker JM, Strackee J.
Spectrum of a series of point events, generated by the integral pulse frequency modulation model.
Med Biol Eng Comput 1985; 23:138-142. - 2
-
Berger RD, Akselrod S, Gordon D, Cohen RJ.
An efficient algorithm for spectral analysis of heart rate variability.
IEEE Trans Biomed Eng 1986; BME-33:900-904. - 3
-
Moody GB.
ECG-based indices of physical activity.
In Computers in Cardiology 1992. Los Alamitos: IEEE Computer Society Press, 1992; 403-406. - 4
-
Albrecht P, Cohen RJ.
Estimation of heart rate power spectrum bands from real-world data: dealing with ectopic beats and noisy data.
In Computers in Cardiology 1988. Los Alamitos: IEEE Computer Society Press, 1989; 311-314. - 5
-
Birkett CL, Kienzle MG, Myers GA.
Interpolation over ectopic beats increases low frequency power in heart rate variability spectra.
In Computers in Cardiology 1991. Los Alamitos: IEEE Computer Society Press, 1992; 257-259. - 6
-
Klieger RE, Miller JP, Bigger JT, Moss AJ, and the Multicenter Post-Infarct
Research Group.
Decreased heart rate variability and its association with increased mortality after acute myocardial infarction.
Am J Cardiol 1987; 59:256-263. - 7
-
Lomb NR.
Least-squares frequency analysis of unequally spaced data.
Astrophysics and Space Science 1976; 39:447-462. - 8
-
Jones RH.
Fitting a continuous-time autoregression to unevenly sampled discrete data.
In Findley DF (ed.), Applied Time Series Analysis II. New York: Academic Press; 1981. - 9
-
Burr RL, Cowan MJ.
Autoregressive spectral models of heart rate variability.
J Electrocardiology 1992; 25(Suppl.):224-233. - 10
-
Press WH, Rybicki GB.
Fast algorithm for spectral analysis of unevenly sampled data.
Astrophysical J 1989; 338:277-280. - 11
-
Press WH, Teukolsky SA, Vetterling WT, Flannery BP.
Numerical Recipes in C: the Art of Scientific Computing.
Second edition. Cambridge Univ Press, 1992.
549-558 [FT], 572-575 [AR], 575-584 [Lomb]. - 12
-
Moody GB, Mark RG, Zoccola A, Mantero S.
Derivation of respiratory signals from multi-lead ECGs.
In Computers in Cardiology 1985. Los Alamitos: IEEE Computer Society Press, 1986; 113-116.
The C program below generates an instantaneous heart rate (HR) signal suitable for Lomb PSD estimation. Its input should be a two-column list of beat arrival times (in seconds) and beat type codes (1 for normal beats, any other value for other types of beats). The output contains a subset of the beat arrival times, with a sample of the HR signal (in units of beats per minute) following each time. The scanf and printf statements may be replaced if different input or output formats are required.
Note that this algorithm aggressively rejects intervals likely to be outliers (whether due to ectopic beats, falsely detected beats, missed beats, or simply mismeasured beat arrival times). When used to derive a Lomb PSD estimate, this strategy works well, and permits robust derivation of spectra even from highly corrupted time series.
When deriving FT or AR spectra, less stringent criteria must be used, since the cost of deleting samples is high (either they must be replaced, or the entire time series must be discarded).
#include <stdio.h>
#include <math.h>
#define NORMAL 1
#define OTHER  2
#define TOL   10    /* tolerance (bpm) */

main()
{
    double ihr, ihrp, mhr = 70., t, tp;
    int b, bp = OTHER;

    while (scanf("%lf%d", &t, &b) == 2) {
        if (b == NORMAL) {
            ihr = 60./(t - tp);
            mhr += (ihr - mhr)/10.;
            if (bp == NORMAL &&
                fabs(ihr - ihrp) < TOL &&
                fabs(ihr - mhr) < TOL)
                printf("%g %g\n", tp, ihr);
            bp = NORMAL;
            tp = t;
            ihrp = ihr;
        }
        else
            bp = OTHER;
    }
}
George B. Moody
2002-04-22
|
If you would like help understanding, using, or downloading content, please see our Frequently Asked Questions. If you have any comments, feedback, or particular questions regarding this page, please send them to the webmaster. Comments and issues can also be raised on PhysioNet's GitHub page. Updated Thursday, 16 July 2015 at 10:25 EDT |
PhysioNet is supported by the National Institute of General Medical Sciences (NIGMS) and the National Institute of Biomedical Imaging and Bioengineering (NIBIB) under NIH grant number 2R01GM104987-09.
|