Beth Israel Deaconess Medical Center and Harvard Medical School, Boston, USA
|
This article originally appeared in Computers in Cardiology 2000, vol. 27, pp. 753-756 (Piscataway, NJ: The Institute of Electrical and Electronics Engineers, Inc.). Please cite this publication when referencing this material. The software described in this article is freely available here. |
Abstract:
We present a new automated method to diagnose and quantify obstructive sleep apnea from single-lead electrocardiograms based on the detection of the periodic oscillations in cardiac interbeat intervals that are often associated with prolonged cycles of sleep apnea. This technique employs the Hilbert transformation of the sinus interbeat interval time series to derive the instantaneous amplitudes and frequencies of the series and calculates their averages and standard deviations over a moving 5-minute window. We then apply a thresholding technique and detect continuous sequences of those windows that lie within threshold limits. When applied to the Computers in Cardiology sleep apnea test data, our algorithm correctly classified 28 out of 30 cases (93.3%) of both sleep apnea and normal subjects, and correctly identified the presence or absence of sleep apnea in 14591 out of a total of 17268 minutes (84.5%) of the data from the test set.
Introduction
Obstructive sleep apnea (OSA), the periodic cessation of breathing during sleep due to intermittent airway obstruction, is a frequently undiagnosed condition affecting millions of individuals worldwide, and is associated with increased morbidity and mortality. Current technology for the diagnosis of sleep apnea requires overnight monitoring of the patient in a specially equipped sleep laboratory. Because of the expense and inconvenience of standard polysomnographic recording, less costly and more easily implemented techniques for detection of high-risk subjects would be desirable.
Our approach is based on the finding that OSA frequently alters healthy heart rate dynamics. In normal healthy respiration, heart rate dynamics exhibit a broadband, inverse power law spectral distribution [1]. In contrast, during periods of prolonged OSA, the heart rate typically shows cyclic increases and decreases associated with the apneic phase and the resumption of breathing [2]. These cycles which tend to oscillate at a frequency of between 0.01 and 0.04 Hz, are a distinctive feature of OSA not found during normal respiration. We hypothesized that we could detect and quantify these periods of high-density OSA by the fully automated identification of these oscillatory dynamics in the RR interbeat interval series.
Methods
The heart rate oscillations accompanying prolonged OSA are transient, and highly nonlinear and nonstationary, typically with varying amplitudes and frequencies [Fig 1a]. These properties cause standard spectral analysis techniques such as the Fourier transformation and autoregressive methods to be ineffective in reliably detecting and localizing episodes of OSA.
The Hilbert transform is an analytical technique for transforming a time series into corresponding values of instantaneous amplitudes and frequencies [3, 4]. By using this technique to transform the RR interval time series into its instantaneous amplitude and frequency components and quantifying the mean values of these components and their stability over time, it is possible to differentiate the periods of cyclic heart rate behavior accompanying prolonged apnea from periods of normal respiration.
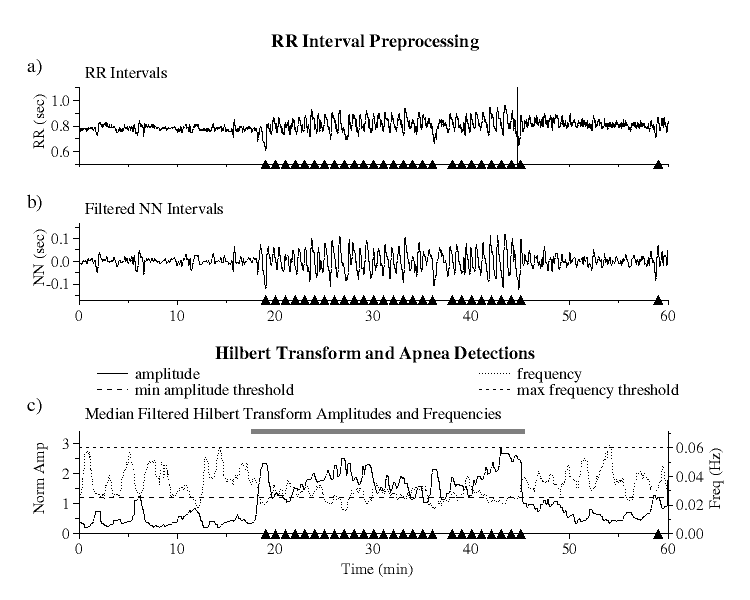 |
| Figure 1. RR interval preprocessing and Hilbert transform amplitudes and frequencies: a) raw RR interval series, b) bandpass filtered NN interval series, and c) Hilbert transformed data showing minimum amplitude (long dashed line) and maximum frequency (short dashed line) threshold limits. Black triangles indicate actual apnea episodes. The grey bar indicates the apnea detection based on our algorithm using the six parameters described in the text. |
RR Interval Preprocessing and Hilbert Transformation
Since the Hilbert transform requires a bandwidth limited signal, the RR interval series must first be preprocessed to isolate frequencies of interest.
To eliminate the effects of ectopic beats from the RR interval series [Fig 1a], we select only normal sinus to normal sinus (NN) intervals as detected by an automated beat detection and classification algorithm. Because QRS detection algorithms may misclassify some ectopics as normal or may miss some normal beat detections, we then apply a moving window average filter to remove the remaining impulse noise due to these outliers as follows. For each set of 41 contiguous NN intervals, a local mean is computed excluding the central interval and those intervals which lie outside the range of 0.4 to 2.0 sec. The central interval is considered to be an outlier and is rejected if its value lies outside of 20% of this mean. This test is applied to each interval in the series and all such outliers are removed.
The filtered NN interval series is next linearly resampled at 1 Hz and bandpass filtered by applying low and high pass filters [Fig 1b]. The frequency range of the bandpass filter is selected to ensure that OSA oscillations will not be filtered out. The low pass filter is a moving window boxcar filter of width 5, giving a 3db cutoff at 0.09 Hz where the value at each point in the series is replaced by the average value over the window centered that at point. The high pass filter uses a local detrending technique over a moving window of 81 data points, giving a highpass 3db cutoff at 0.01 Hz. At each point in the series, the slope of the regression line over a window centered at that point is computed, and the value of this fit at the central point is subtracted from the actual value at this point.
The Hilbert transform is then applied to the filtered NN interval series and the instantaneous amplitude and frequency calculated at each point. Since the amplitudes and frequencies of the transformed data exhibit large fluctuations around their mean values, to eliminate this noise they are each median filtered using a moving window of 60 points. To compensate for the differing amplitudes of heart rate variability among different subjects, the amplitudes are then normalized so that their average value over the entire time series is equal to one [Fig 1c].
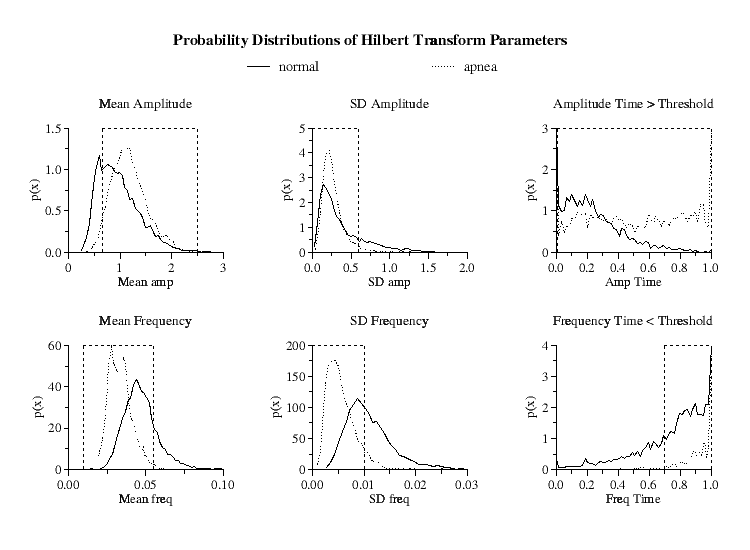 |
| Figure 2.
Hilbert transform amplitude and frequency probability distributions
for the means, standard deviations and time within threshold limits for the
5-minute windows of all periods of normal respiration and high-density OSA.
Parameter limits indicated by dashed vertical lines optimize minute-by-minute
true positive and true negative apnea detections. Ordinates |
Apnea Detection
The median filtered Hilbert amplitudes and frequencies are then analyzed over 5-minute windows incremented for each minute. Six parameters are calculated for each window increment: the average and standard deviation of both the amplitudes and frequencies over the window and the fraction of time that the amplitudes and frequencies are each separately within their predefined threshold limits [Fig 1c].
To compare the distributions of these parameters for normal respiration and for periods of prolonged OSA, we combined the PhysioNet Polysomnographic and Normal Sinus Rhythm (NSR) databases [5] together with the Computers in Cardiology (CinC) training dataset [5]. For the periods of normal respiration, in addition to the eight hours of data from each of the 10 normal subjects in the CinC training set, we selected from the 18 subjects in the NSR database the six hours of lowest heart rate, corresponding to periods of sleep, giving a total of 188 hours of normal respiration. For periods of prolonged OSA, we selected from the the CinC training set and Polysomnographic database those periods of time that were 15 minutes or greater in duration during which there was at least 1 episode of apnea per minute, giving a total of 117 hours of prolonged high-density OSA.
Since the probability distributions of these six parameters are different for the periods of prolonged sleep apnea compared to periods of normal respiration [Fig 2], by an appropriate selection of ranges for these parameters, it is possible to selectively isolate windows of periodic NN interval behavior.
However, due to the overlap between the distributions, to discriminate the periods of prolonged periodic heart rate dynamics in high-density OSA from periods of intermittent heart rate periodicity found in normals, we further require that each of these six parameters be continuously within their specified limits (defined below) for a minimum of 15 minutes to qualify as a detection of an apnea episode.
To determine the particular values of the Hilbert amplitude threshold and the distribution parameter limits that give the best apnea detection, each of these parameters were incrementally varied, and statistics were calculated from multiple computer runs using data from the combined Polysomnographic, NSR and CinC training set databases. The parameters selected were those that gave the highest percentage of minute-by-minute true positive and true negative apnea detections in these combined sets.
By this method, the ``optimal'' minimum Hilbert amplitude threshold was
determined to be a linear function of the minimum and maximum Hilbert
amplitudes given by
where
| mean amplitude (normalized) | : | 0.65 | - | 2.5 |
| standard deviation of amplitude | : | 0 | - | 0.6 |
| mean frequency (Hz) | : | 0.01 | - | 0.055 |
| standard deviation of frequency | : | 0 | - | 0.01 |
| time above amplitude threshold | : | 0.006 | - | 1.0 |
| time within frequency thresholds | : | 0.7 | - | 1.0 |
Finally, to separate subjects with severe OSA from normal subjects, we require that a minimum of 5% of the total time of the RR interval series be detected as apnea.
Results
Applying this technique to the CinC training set, we are able to correctly classify 26 out of 30 (86.6%) of combined sleep and normal subjects, and correctly identify the presence or absence of sleep apnea in 13985 out of a total of 17045 minutes (82.1%) of the data.
When this technique is applied to the CinC test set, this algorithm correctly classified 28 out of 30 (93.3%) of the subjects, and correctly identified the presence or absence of sleep apnea in 14591 out of a total of 17268 minutes (84.5%) of data from the test set.
Discussion
By using the Hilbert transformation of the RR interval time series, we have shown that it is possible to detect prolonged episodes of high-density OSA from single-lead electrocardiograms with a high degree of accuracy, discriminating both subjects with OSA and determining the onset and offset of prolonged high-density OSA. In addition, this technique is able to quantify both the amplitude of OSA heart rate oscillations and their frequencies. Improvements in filtering techniques and parameter adjustments may further increase the efficacy of this technique.
Although this technique is ineffective in detecting the small number of sleep apnea subjects who do not exhibit the oscillatory heart rate dynamics commonly found in prolonged OSA, it may prove to be a cost-effective and convenient means to screen for OSA and to monitor response to therapy. It may also be useful in detecting and quantifying other pathologic heart rate oscillations, such as those found in Cheyne-Stokes syndrome or periodic breathing at high altitude [6], as well as fetal distress syndromes [7].
Acknowledgements
This work was supported in part by grants from NIMH(MH54031), NCRR(RR13622), the G. Harold and Leila Y. Mathers Charitable Foundation and The Fetzer Institute. We thank G. B. Moody for helpful discussions.
References
- Kobayashi, M. and Musha, T., 1/f fluctuation of heartbeat period., IEEE Trans Biomed Eng, 29:456-457. 1982.
- Guilleminault, C. and Connolly, S. and Winkle, R. and Melvin, K. and Tilkian, A., Cyclical variation of the heart rate in sleep apnoea syndrome. Mechanisms, and usefulness of 24 h electrocardiography as a screening technique, Lancet, 1:126-131. 1984.
- Ivanov, P. C. h. and Rosenblum, M. G. and Peng, C-K. and Mietus, J. and Havlin, S. and Stanley, H. E. and Goldberger, A. L., Scaling behaviour of heartbeat intervals obtained by wavelet-based time-series analysis, Nature, 383:323-327. 1996.
- Peng, C-K. and Mietus, J. E. and Liu, Y. and Khalsa, G. and Douglas, P. S. and Benson, H. and Goldberger, A. L., Exaggerated heart rate oscillations during two meditation techniques, Int J Cardiol, 70:101-107. 1999.
- PhysioNet: An NIH/NCRR Research Resource for Complex Physiologic Signals. http://www.physionet.org
- Lipsitz, L. A. and Hashimoto, F. and Lubowsky, L. P. and Mietus, J. and Moody, G. and Appenzeller, O. and Goldberger, A. L., Heart rate and respiratory rhythm dynamics on ascent to high altitude, Br Heart J, 74:390-396. 1995.
- Kang, A. H. and Boehm, F. H., The clinical significance of intermittent fetal sinusoidal
heart rate, Am J Obstet Gynecol, 180:151-152. 1999.
Footnotes
- *
- Note: in the original published
version of this paper the values for
 and
and  were incorrectly
given as = 0.3 and = 1.85.
were incorrectly
given as = 0.3 and = 1.85.