The pNNx Heart Rate Variability Metric:
A Generalization of pNN50
(pnnlist)
JE Mietus,1 C-K Peng,1 I Henry,1 RL Goldsmith,2
AL Goldberger1
1Margret and H.A. Rey Institute for Nonlinear Dynamics in Physiology
and Medicine, Cardiovascular Division, Harvard Medical School/Beth Israel
Deaconess Medical Center, Boston, MA
2Division of Circulatory Physiology, Columbia-Presbyterian Medical Center,
New York, NY
A detailed description of an application of the pNNx algorithm can be found in:
Please cite this publication when referencing this material, and also include the standard citation for PhysioNet:
Background
The pNN50 statistic is a time domain measure of heart rate variability (HRV) derived from a study by Ewing and colleagues [1], who introduced the NN50 count, defined as the mean number of times per hour in which the change in consecutive normal sinus (NN) intervals exceeds 50 milliseconds. The authors proposed this measure to help assess parasympathetic (vagal) activity from 24 hour ECG recordings.
Subsequently, Bigger and colleagues [2] introduced
pNN50 = (NN50 count) / (total NN count)
(that is, the fraction of consecutive NN intervals that differ by more than 50 ms). The pNN50 measure has proved very useful in providing diagnostic and prognostic information in a wide range of conditions.
The pNN50 statistic, however, is only one member of a family of statistics, designated here as pNNx, where x > 0 ms. Computing pNNx with x < 50 ms in both long and short term recordings may provide more robust discrimination between groups than the standard pNN50 statistic.
In [3], we applied the pNNx method to previously acquired RR interval data for 155 subjects. Comparisons were made between:
- healthy subjects vs. those with congestive heart failure (CHF)
- healthy subjects while asleep vs. healthy subjects while awake
- healthy young subjects vs. healthy elderly subjects
(See this note for information about the links above.)
The results of these comparisons, as described in [3], showed better discrimination between groups when using values of x significantly less than the traditional 50 milliseconds.
The original data used for this study are available here (as a 17 MB tarball, pnnx-rr-orig.tar.gz). These data can be analyzed with either the original or current versions of the software used for this study to replicate the results reported in [3]. The original data include over 10 million beat labels; as errors are found, they are corrected in the on-line copies of the data. In comparison with the original software, the current version incorporates additional input checking, a user interface that more closely matches that of other PhysioToolkit software, dynamic rather than static input array allocation (so that input series of any length can be accommodated, up to the limit of available system memory), and a faster and more robust sorting algorithm.
The pNNx software package expands the analysis capabilities of the widely used pNN50 measure, providing researchers with the flexibility to test various thresholds for optimal discrimination of HRV in populations of interest.
Obtaining the pNNx software
The pNNx software package consists of a Makefile, the pNNx shell script, and the pnnlist.c source code. The pnnlist code is also separately available as prebuilt binaries for GNU/Linux, Mac OS/X, MS-Windows and Solaris.
Prerequisites
- Unless you already have an annotation interval list in the correct format for a recording you wish to study, you will need to install the WFDB Software Package, version 10.3.2 or later. This package includes programs (sqrs and wqrs) for detecting the QRS complexes (beats) in a digitized ECG and recording their locations in beat annotation files, and a program (ann2rr) for preparing an annotation interval list from an annotation file (such as those in PhysioBank or those created using sqrs or wqrs). The WFDB Software Package is available freely from this site in portable C source form and as ready-to-run binaries for several popular platforms.
- (Under MS-Windows only, and only if you wish to compile the pNNx sources or use the pNNx shell script) Install the free Cygwin environment if you have not already done so. Cygwin includes tar and gzip, needed to unpack the pNNx package, the gcc C compiler and all other utilities needed to compile the pNNx code from sources, and the bash shell needed to run the (optional) pNNx shell script. These utilities are standard under GNU/Linux, Mac OS/X, and all versions of Unix.
- If you wish to plot the pNNx distributions as in the illustrations below, we recommend installing the plt software package, which is available freely from this site in portable C source form and as ready-to-run binaries for several popular platforms. The pNNx software produces text output only; you will need plt or comparable software to obtain graphical output.
Downloading and compiling the pNNx sources
The pNNx software is written in portable C and can be compiled on any modern platform.
-
(Under MS-Windows only) Install the free Cygwin environment if you have not already done so.
-
Download pNNx.src.tar.gz and unpack it:
tar xfvz pNNx.src.tar.gzIf your version of tar doesn't support the z option, unpack the package in two steps:
      gzip -d pNNx.src.tar.gz
      tar xfv pNNx.src.tar
(You may also view or download the individual files.)
-
Enter the source directory (pNNx/src) and compile the software:
make
Downloading pNNx binaries
Precompiled binaries are available for several popular platforms:
-
Solaris 8 (SPARC):
- Download pNNx.sol-8.tar.gz.
- Unpack it:
tar xfvz pNNx.sol-8.tar.gz
-
Linux (x86):
- Download pNNx.i386-linux.tar.gz.
- Unpack it:
tar xfvz pNNx.i386-linux.tar.gz
-
Mac OS/X:
- Download pNNx.mac-osx.tar.gz.
- Unpack it:
tar xfvz pNNx.mac-osx.tar.gz
-
MS-Windows:
- Download pNNx.msw.zip.
- In a Command or Cygwin window, unzip it:
unzip pNNx.msw.zip
Using the pNNx software
You will need either a beat annotation file or an annotation interval list in order to obtain a pNNx distribution.
The pNNx shell script reads a beat annotation file (either from a local copy or directly from the PhysioNet web server). It uses ann2rr (included in the WFDB Software Package) to create an annotation interval list, which is then passed to pnnlist for analysis.
The pnnlist program reads an annotation interval list, identifies the consecutive NN intervals, and calculates the pNNx distribution from them. This program prints each unique normal sinus to normal sinus (NN) interval increment and the percentage of NN interval increments greater than that value.
Beat annotation files
Annotation files are the standard way of storing information about the locations (times of occurrence) and types of events that occur during the recordings available in PhysioBank. Beat annotation files are available for most of the PhysioBank records that include ECGs.
If you wish to study a recording for which no beat annotation file is available, you may be able to create one with sqrs or wqrs (included in the WFDB Software Package).
See the PhysioNet FAQ for additional information about annotations and annotation files.
Annotation interval lists
Annotation interval lists as used by pnnlist are in text format, consisting of two columns (intervals in seconds and annotations). Interval lists in this format can be prepared from beat annotation files using ann2rr. For example, the command
ann2rr -r nsrdb/16265 -a atr -A -i s8 -w
creates an interval list from the atr (reference) annotations for record 16265 of the MIT-BIH Normal Sinus Rhythm Database. (For details on this command, see ann2rr in the WFDB Applications Guide.) The first few lines of output from this command are:
		0.00781250	|
		0.39843750	N
		0.60156250	N
		0.60937500	N
		0.60156250	N
		0.62500000	N
		0.60937500	N
		0.62500000	N
		0.59375000	N
		0.60156250	N
		0.61718750	N
		0.61718750	N
		    .
		    .
		    .
Each N in the interval list indicates that a normal sinus beat occurs at the end of the corresponding interval. (The initial "|" marks a QRS-like artifact at the beginning of the recording. The first two intervals shown above are not used in the calculation of pNNx since they do not begin and end with N annotations.)
Usage
Both pNNx and pnnlist are text mode applications that must be run in a terminal window (under MS-Windows, a Command or Cygwin window). Read about how to use them below, or in Unix man page format here (also in man page source format here).
To run pNNx, type a command such as
pNNx -r nsrdb/16265 -a atr
where nsrdb/16265 is the record name and atr is the annotator name of the beat annotation file you wish to study. (If you have not previously downloaded the annotation file into a local nsrdb directory, pNNx (via ann2rr) obtains the annotations directly from PhysioNet.)
To run pnnlist, open a terminal window (under MS-Windows, a Command window), and type a command such as
ann2rr -r nsrdb/16265 -a atr -A -i s8 -w | pnnlist
Alternatively, you can save the output of ann2rr in a file, and then read the file with pnnlist, using commands such as:
        ann2rr -r nsrdb/16265 -a atr -A -i s8 -w >16265.intervals
        pnnlist <16265.intervals
This method can also be used if you have obtained an interval list from another source.
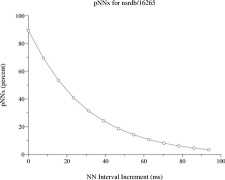
These commands will then print each unique NN interval increment in milliseconds along with the percentage of intervals greater than that value. All three of the examples above produce the same output; the first few lines are shown at left below, and plotted at right below:
0	89.2738
7.8125	69.4564
15.625	53.3662
23.4375	40.8539
31.25	31.4265
39.0625	24.1817
46.875	18.4763
54.6875	14.1261
62.5	10.7312
70.3125	8.06025
78.125	6.09401
85.9375	4.56975
93.75	3.47841
101.562	2.66896
        .
        .
        .
|
|
To capture the output of any of these commands, redirect its output to a file, as in:
pNNx -r nsrdb/16265 -a atr >16265.pNNx
Options for pNNx and pnnlist
In addition to the standard definition of pNNx given above, several variants can also be obtained using pNNx and pnnlist.
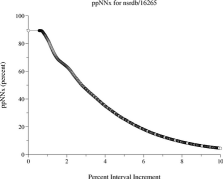
Percent pNNx (ppNNx)
In this variant, each NN interval increment is expressed as a percentage of the first of the two intervals. This can be obtained by using the -p option with pNNx or pnnlist. For example,
pNNx -r nsrdb/16265 -a atr -p
yields:
0		89.2738
0.564972	89.2728
0.574713	89.2718
0.581395	89.2708
0.584795	89.2698
0.588235	89.2688
0.591716	89.2658
0.598802	89.2637
0.60241		89.2617
0.606061	89.2577
    .
    .
    .
|
|
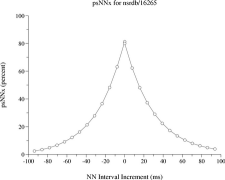
Signed pNNx (psNNx)
In this variant, the positive and negative increment distributions are calculated separately. Specify this variant using the -s option with pNNx or pnnlist. For example,
pNNx -r nsrdb/16265 -a atr -s
yields:
-492.188	0
-390.625	0.00352566
-382.812	0.00528849
-359.375	0.00705132
-351.562	0.00881414
-343.75		0.010577
-328.125	0.0123398
-312.5		0.0141026
-304.688	0.0193911
-296.875	0.0229168
    .
    .
    .
460.938		0.0187779
468.75		0.0150223
484.375		0.0131446
492.188		0.0112668
500		0.00938897
523.438		0.00751117
546.875		0.00563338
562.5		0.00375559
625		0.00187779
679.688		0
|
|
Fixed increment pNNx
In addition to listing pNNx at each distinct NN increment value, pNNx and pnnlist can output results at specified increments using the -i option followed by the desired increment (in milliseconds). For example,
pNNx -r nsrdb/16265 -a atr -i 10
yields:
0 89.2738 10 69.4564 20 53.3662 30 40.8539 40 24.1817 50 18.4763 60 14.1261 70 10.7312 80 6.09401 90 4.56975 . . . |
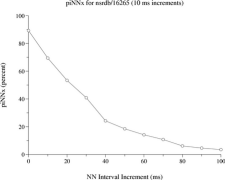
See a larger plot of this fixed increment pNNx distribution. |
Selecting a segment of a longer annotation file
When using pNNx, you may select a segment of the annotation file to be analyzed, using the -f (from) and -t (to) options, as in:
pNNx -r nsrdb/16265 -a atr -f 1:30:00 -t 4:30:00
where the times following these options specify the start and end of the segment (in hours, minutes, and seconds from the beginning of the recording). These options are also accepted by ann2rr.
How does pnnlist work?
The sequence of steps involved in the computation of pNNx, as implemented by pnnlist, is as follows:
From the annotation interval list, each triplet of three consecutive normal sinus beats is found, and the NN interval increment is calculated as I2,3 - I1,2 (the difference of the interval between the second and third beats and that between the first and second beats). For standard pNNx, the absolute value of this difference is used as the NN interval increment.
The NN interval increment series is then sorted by increasing value, and NNx (the number of increments less than or equal to each unique increment x), is counted.
-
The fraction of NN interval increments greater than x is then given by
pNNx = 1 - NNx/NN0where NN0 is the total number of NN interval increments.
References
- Ewing DJ, Neilson JM, Travis P. New method for assessing cardiac parasympathetic activity using 24 hour electrocardiograms. British Heart Journal 52:396-402; 1984.
- Bigger JT Jr, Kleiger RE, Fleiss JL, et al. Components of heart rate variability measured during healing of acute myocardial infarction. Am J Cardiol. 61:208-215; 1988.
- Mietus JE, Peng C-K, Henry I, Goldsmith RL, Goldberger AL. The pNNx files: re-examining a widely used heart rate variability measure. Heart 88:378-380; 2002.
We gratefully acknowledge Dr. Phyllis Stein for her generous contribution of data.
|
If you would like help understanding, using, or downloading content, please see our Frequently Asked Questions. If you have any comments, feedback, or particular questions regarding this page, please send them to the webmaster. Comments and issues can also be raised on PhysioNet's GitHub page. Updated Friday, 21 October 2016 at 15:45 EDT |
PhysioNet is supported by the National Institute of General Medical Sciences (NIGMS) and the National Institute of Biomedical Imaging and Bioengineering (NIBIB) under NIH grant number 2R01GM104987-09.
|